General Relativity (‘Relative Inner’ vs ‘Relative Outer’ )
Expect the blog to feature many, many posts about the biostratigraphy panels. There are so many combinations of panel options that I shouldn’t think anybody is au fait with all of them – probably not even me! I want to start with something relatively (excuse the pun) simple. I’m also choosing this because it’s something that wasn’t possible before the new charts module was released.
My examples use data from our demo dataset. My template starts out as a simple ‘group by category’ palynology panel – that is, I’ve kept all the basic options except changing “group data by” to “category”. In the real world this would be better as groups, for which you will also need to restrict the outer panel to a group set.
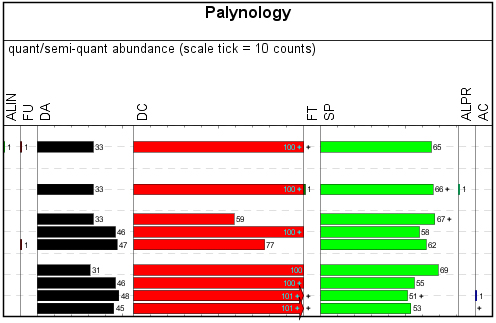
Everybody should be familiar with the “relative (inner)” calculation style – it’s been in StrataBugs since the year dot. It would transform a simple absolute-abundance style plot like this:
Into a relative-abundance plot like this:
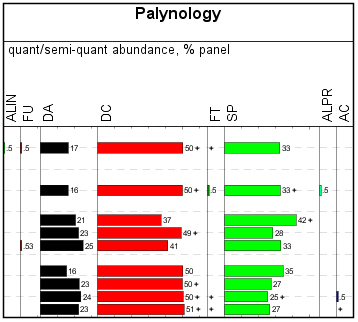
Each column shows its count relative to the total count for the analysis across the whole panel. Each row adds up to 100%. Well, OK, nearly 100% – since you asked, we’re rounding up to integer values except where we have less than 1%.
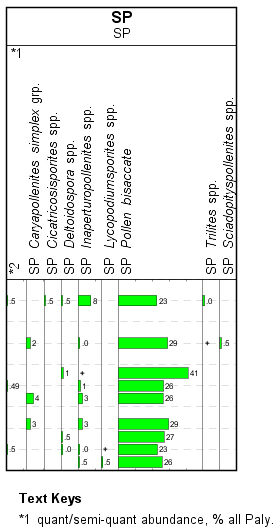
Now, what if instead of the category totals, you want to show individual species, but as a percentage of the total fossil count? If you switch the “group data by” option back to “species”, this is exactly what you’ll get, except that you will lose the neat category grouping.
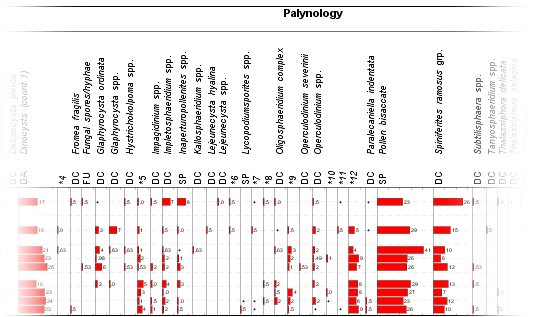
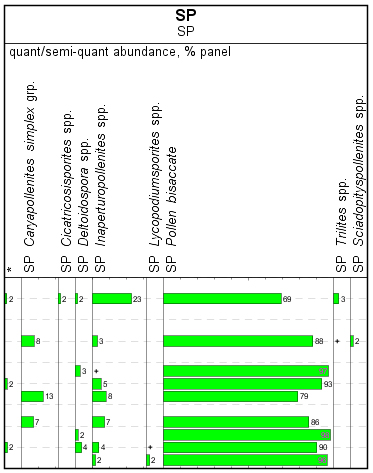
If I show just the SP instead, the values only reflect percentages of the SP total. For example, in the first analysis, Pollen bisaccate is 23% of the total paly count (above), but 69% of the SP total (below).
Here’s the bit where we need to use the new concept of inner vs outer panels. If this is a new concept, bear with me. All you really need to know is that the biostratigraphy panel behaves a bit like a mini block – it has panels within itself, which we call “inner panels”. There are a set of properties which affect all inner panels, and then each inner panel has properties of its own.
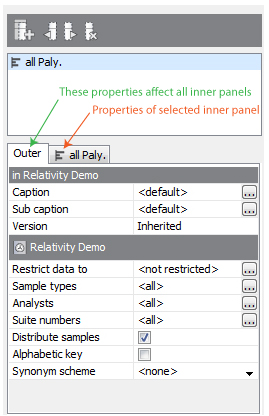
Crucially, you can restrict the the data of both the inner and outer panels separately, such that the data for any inner panel is a subset of the outer panel. In the previous panel, I applied the restriction “SP” to the inner panel only.
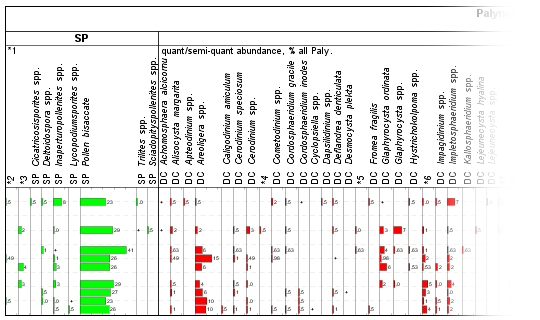
Now, changing the calculation style of this SP inner panel to “relative (outer)” changes the calculation to use the total of whatever data would be included in the outer panel. In this case, because I haven’t changed it, it will be “all paly”. Now I’ve got just the SP, but relative to all of the paly data:
I could include inner panels for the other important categories too:
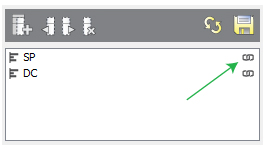
Note that the inner panels have exactly the same properties as each other, except for “restrict data by”. This means you can leave them with linked properties:
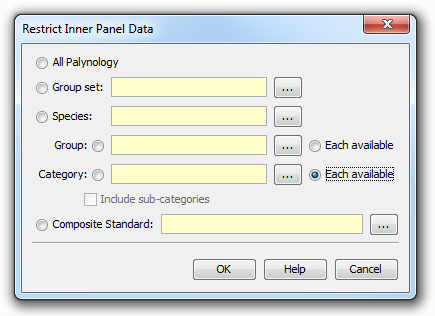
Or, for extra points, this is a great time to make use of the ‘one panel per category’ option when you restrict the data. This means that whatever data are present, you will get one inner panel for every relevant category.
One comment
Comments are closed.
Although the Inner/Outer panel concept is new, the same functionality was available in the old chart system using the option to plot the panel as a % of the Group Set (with optional filter category).