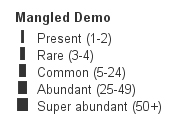
Abundance Events in Stratigraphic Range Charts
In recent weeks we’ve been busy enhancing the stratigraphic range chart plot to display abundance events. Many thanks to Martin Pearce at Evolution Applied for working through this with us.
The stratigraphic range panel is designed as an alternative type of view on a composite standard (event scheme). It shows the ranges of events in time.
A note on terminology: the ‘range chart’ I will be referring to is different from a ‘species distribution chart’ showing abundance variations in a well section – which I do often hear referred to as a ‘range chart’. The range chart in question is concerned with time.
A simple range chart showing a few species might look like this:
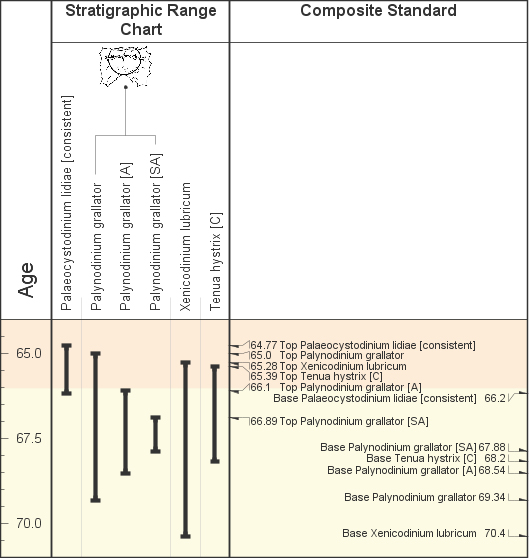
Events relating to the same species are grouped together. In this case there are three events for Palynodinium grallator – a total species range, plus two abundance event ranges.
At the moment there is no formal way to link these abundance events (denoted by the [A] and [SA]) to an abundance scheme which defines them. A simple workaround is to create an abundance scheme with exactly the same name as the composite standard. The stratigraphic range panel will pick this up and use it to identify abundance events. Any term abbreviation from the abundance scheme which appears in the event name surrounded by brackets (you may use parentheses, square or angled brackets) will be interpreted as an abundance event.
Switching on the “abundance” option in the stratigraphic range panel properties now shows:
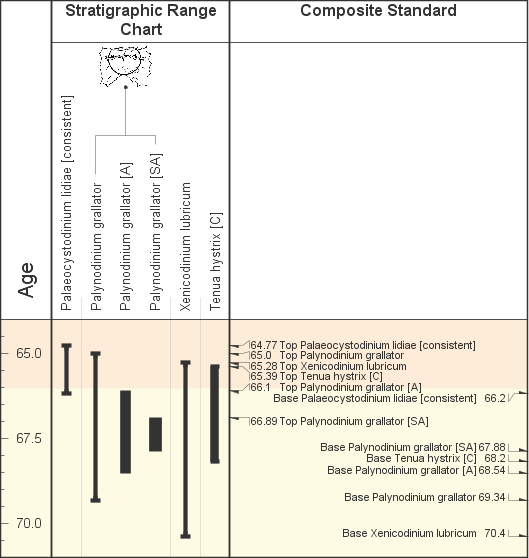
The thickness of each bar is increased by one step for every level in the abundance scheme (where the first level receives the standard thickness).
You can further compact the chart by opting to combine the separate abundance columns into one combined column (the “abundance groups” option):
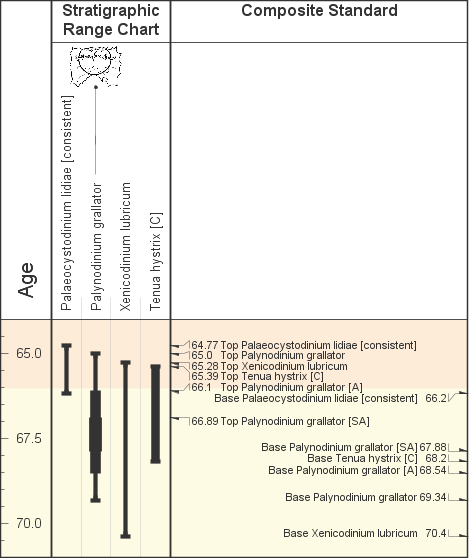
Note that you can’t make interactive changes to the event ranges if they are combined in this manner.
We are constrained by the data model at the moment, but in version 2.2 we intend to formalise the relationship between a composite standard (and its events) and an abundance scheme (and its classes). This plot will then be less reliant on exact scheme and event names.