Adding new zones from a chart
We try to make it as easy and ‘safe’ as possible for you to explore StrataBugs without inadvertantly corrupting your data. That’s why we always ask you to confirm before deleting something. Last week we were clicking about in this way (exploring), trying to think through an idea, when we stumbled upon a feature that we’d completely forgotten was there.
A helpful user had made a great suggestion. In their own words:
Being able to add interpretations (e.g. chronostrat) via the charts in the Samples & Interpretations module would be a very useful addition, rather than having to keep switching tabs back and forth.
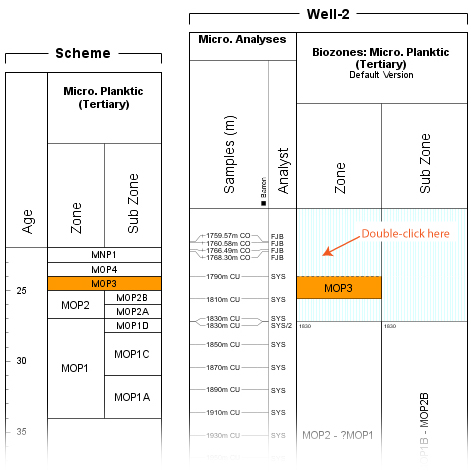
The thought process on our side goes something like this: Well, yes, that would be good! How would that work? Double-click somewhere? There’s already some double-click action in the zones panel (*try double-clicking in a zones panel*) – you can edit existing zones by double-clicking on them. So, maybe double-click where there isn’t a zone? (*double-click where there’s no zone*) Hey, look, it brings up the interval dialog! So we already implemented this! (*try the same on another panel*) Oh dear, doesn’t seem to work in this panel, why’s that?
There are, literally, millions of lines of code in StrataBugs. It’s not surprising that we forget about some of them.
Having examined that code there are a few constraints to this neat feature, which may make it appear (to the untrained or just forgetful eye) that it doesn’t work all of the time. It does in fact work pretty well in the circumstances where you’d need it. To add a new interval you can double-click in the column above or below the existing intervals. The ‘add interval’ dialog will appear if:
- You clicked entirely above (or below) the existing data;
- There is an analysis above (or below) the existing data (and in the appropriate discipline if you’re in a biozone column), whose sample will be selected for you as the top and base of the new interval;
- There is a unit in the scheme which is younger (or older) than the highest (or lowest) one you have picked in your section, in a hierarchy level included in the column you clicked in. This unit will be automatically selected. Of course, this won’t work if you haven’t invested any effort into putting ages on your scheme unit boundaries, as it will not know the relationship between the scheme’s units.
So there you have it. Thanks to our friends at CGG for the suggestion – remember folks, if you don’t ask, you don’t get!