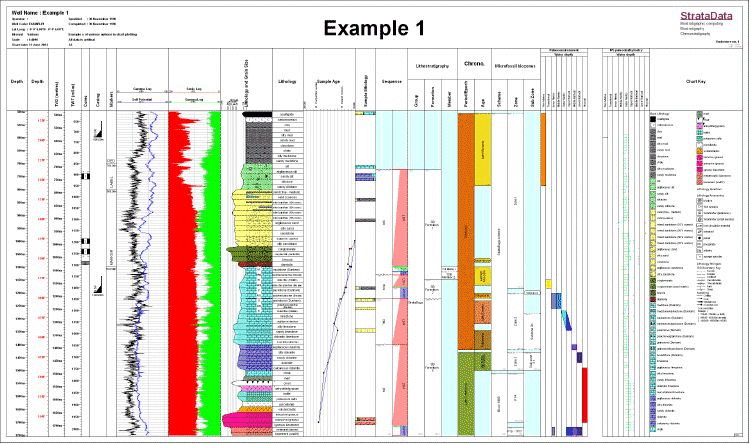
Example 1: Summary chart with panels displaying various depth scales, cores, casing, markers, wireline logs, graphic lithologies, IGD (interpreted geological data) including sequences, lithostratigraphy, chronostratigraphy, biozones, palaeoenvironments and chart key.
Click on a panel for a larger image and description.
