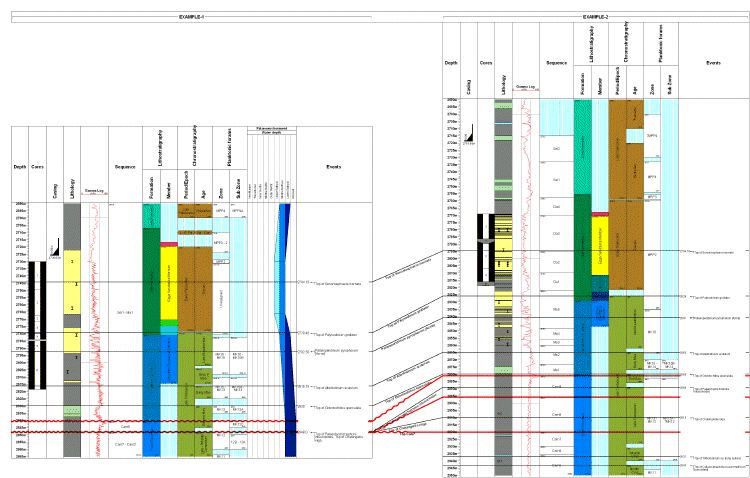
Example 4: Chart showing a stratigraphic correlation of two wells based on biostratigraphic events and IGD boundaries displayed on a depth scale.
Click on a panel for a larger image and description
<< back to example charts