Charts in HTML
You can output a chart to a basic HTML table, which you can edit and use for written repots.
- In the Samples & Interpretations module, set up a chart tab (it can be either the Standard Chart or a template of your choice) which includes the elements you want in the final table. Note that not panels types can be exported (they will just be ignored). The HTML writer will attempt to honour as much panel formatting as possible (e.g. options to show depths on boundaries, or use colours).
- With the chart tab selected, choose File | Export Chart | As HTML from the main menu.
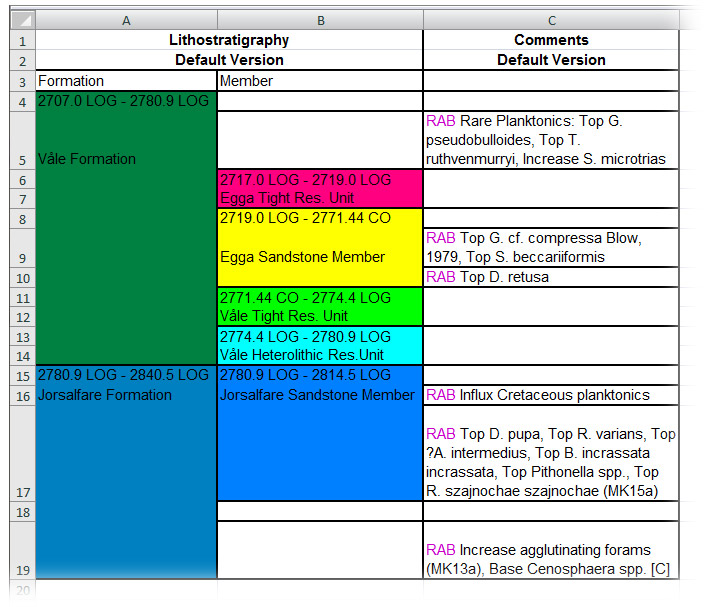
- The table uses one row for each sample which appears in the data. Cells are merged where data spans more than one sample (e.g. intervals). For intervals, the first row of the merged cell is the top sample, but the base sample is outside the merged range.
- You can open the .html file in many other software packages, e.g. Microsoft Word or Excel. You can change the text and formatting as required for your report.
Page last updated: 03-Dec-2014 16:32