| << Previous | Learning Trail | Contents | Section 7: Charts | Next >> |
| StrataBugs Learning Trail | Section 7: Charts |
Charts tab
The Samples & Interpretations module's Charts tab offers quick, visual access to the current well's data. Charts are interactive; the charts tab itself is intended as an interpretation tool, for viewing and manipulating data. Any chart can be printed, but modification of block and panel template designs cannot be performed here.
Different charts are displayed in tabs on the right-hand side of the main Charts tab. An automatic "standard" chart tab is always visible. Well block templates and charts containing a template block may also be opened in their own tabs. The configuration of the Charts tab (which templates are open along with their chart properties) are stored on a per-user, per-well basis.
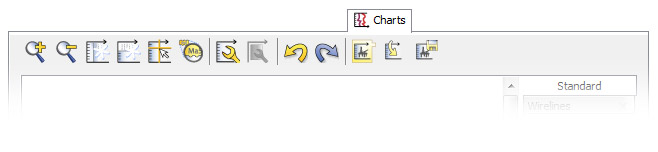
Use the two zoom icons to zoom the display in and out (or hold CTRL and press the + and - buttons on your keyboard).
- You can use the mouse wheel (if you have one) to scroll vertically.
- Hold down SHIFT and use the mouse wheel to scroll horizontally.
- Hold down CTRL and use the mouse wheel to zoom in and out.
- Use the shortcut keys CTRL + 1 to reset the zoom to 100%.
- Use the shortcut keys CTRL + 0 to change the zoom such that the entire chart fits on the screen.
- Hold down ALT and drag the mouse to zoom to an area of your choice.
You can toggle the ![]()
![]() Freeze Header buttons to keep the horizontal and/or vertical headers displayed when scrolling. For example, the horizontal header often contains taxon names which it is useful to keep in view. By default the vertical header is the first panel (often depth), but you can add more panels to it via the Chart Properties dialog (see below).
Freeze Header buttons to keep the horizontal and/or vertical headers displayed when scrolling. For example, the horizontal header often contains taxon names which it is useful to keep in view. By default the vertical header is the first panel (often depth), but you can add more panels to it via the Chart Properties dialog (see below).
Use ![]() toggle on a crosshair which follow your cursor around the screen. The magnifier
toggle on a crosshair which follow your cursor around the screen. The magnifier ![]() gives you a close-up view of a small area of the chart without you having to zoom in and out; it can also be toggled by holding down the Q key on your keyboad.
gives you a close-up view of a small area of the chart without you having to zoom in and out; it can also be toggled by holding down the Q key on your keyboad.
The yellow and blue ![]()
![]() undo and redo buttons allow you to step back and forward through data edits made via the chart. Each chart template tab has its own undo queue, so you will only be undoing what you can see in front of you. You can also use CTRL+Z to undo, and CTRL+SHIFT+Z to redo via the keyboard.
undo and redo buttons allow you to step back and forward through data edits made via the chart. Each chart template tab has its own undo queue, so you will only be undoing what you can see in front of you. You can also use CTRL+Z to undo, and CTRL+SHIFT+Z to redo via the keyboard.
You can detach the charts tab into a floating window, allowing you to view the chart data in a floating window alongside the table data. Use the File | Detach selected well chart tab menu option.
You can print these charts by selecting the appropriate chart tab and on the File menu, choosing Print | Chart. See also Printing v2 Charts. You can export images of the charts to PDF and SVG files.
Many chart panels allow you to interact with the displayed data. Some examples are shown below. See individual panel pages for more.
Interact >> |
|
Versions
All chart template tabs inherit their version from the Interpretations tab. To change the version, go the interpretations tab use use the version selector.
When you add panel templates to a block template, you can select a version, or leave the version blank. Panels with no version explicitly set will inherit the block's version, which in this case will be the version on the Interpretations tab. To show a different version or display different versions side-by-side, select the version for panels in your well block template design.
Standard (Along Hole Depth) Chart
The standard chart is created automatically for every well, and cannot be closed or saved. A panel is added for every data type which appears in the well. Adding new data will result in new panels being added. The standard chart is always plotted on a MD ("measured depth") scale.
The panels are based on the default panel template for their panel type. They have default captions, and versionable panels will by default inherit the version set on the Interpretations tab (you can change the version by right-clicking and selecting Panel Properties, see below).
You can edit the properties of the default panel, or set a different panel as the default, in the charts module.
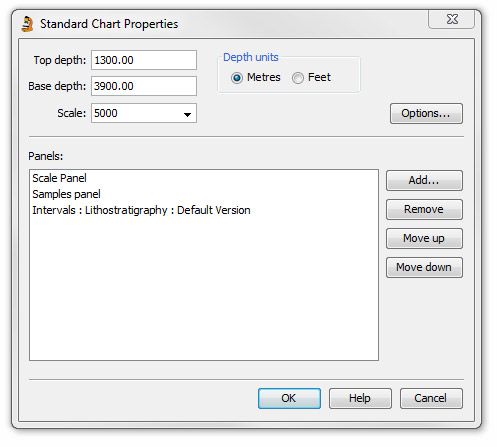 |
Press You can also add, remove and reorganise the panels. Press Options for additional Chart Properties. The layout of this chart is not stored, and will return to its default next time you start a session. |
Designing Panel Templates and Well Blocks with the Standard Chart
You can use the standard chart to design and save panel templates and well block templates. This workflow allows you to see real data when designing your templates.
- You can make "local" changes to the panel properties by right-clicking on a panel and selecting Panel Properties. These properties will not be saved. You can also change attributes which normally belong to block templates, such as the caption and version.
- You can revert to the properties of the default panel template for the type by right-clicking and choosing Restore default template.
- You can save local panel properties to a named panel template by right-clicking on a panel whose design you have edited and choosing Save local properties as template. You will be warned if your new selection is similar to any existing panel templates. Remember that captions and versions are NOT part of panel templates!
- You can save the entire Standard chart as a new well block template (or overwrite an existing one) using the
 icon on the toolbar. The panels in this block template will either:
 - use the default panel template for their type
- use a decoupled panel template, if you have edited the panel properties. You can promote this to a named panel template in the Charts module.
- You can populate the Standard chart as a copy of an existing well block template by pressing the
 icon. The Standard chart will use the panel templates from this block, but is NOT linked to the block template (updates to the block template will not be reflected in the Standard chart). Any changes you make to panels will be discarded unless you save the Standard chart to a block template as described above.
Opening Well Block and Chart Template Tabs
You may open a well block template in its own tab. Press the open template ![]() icon, and search using the Template Manager dialog. The block displays the current well and its version is inherited from the Interpretations tab. Use the toolbar buttons to adjust the appearance:
icon, and search using the Template Manager dialog. The block displays the current well and its version is inherited from the Interpretations tab. Use the toolbar buttons to adjust the appearance:
| The block properties include vertical scale limits (e.g. top depth) and scale type (e.g. measured depth or age). They are set using a floating palette. All changes are saved automatically. | |
| The chart properties include font style, header and key, and background scheme. All changes are saved automatically. | |
| You can't edit the template here, but you can press the edit template icon to open it in Charts. |
You can also open a chart template, as long as it contains a "template block" (a block with no well assigned - see this tutorial). The current well is displayed in this unassigned block. You can edit the block properties (such as depth range, scale etc), but not the other chart properties, which belong to the chart template.
Having a chart or block template open in the charts tab does not prevent that block template from being deleted.
Using block and chart templates in this way means that you do not have to store and maintain separate charts for every well section.
Page last updated: 25-Jan-2016 11:28