| << Previous | Learning Trail | Contents | Section 7: Charts | Next >> |
| StrataBugs Learning Trail | Section 7: Charts |
Charts
A StrataBugs chart consists of one more more block templates with applied block properties (including a well context), along with a set of chart properties. It may also include one or more correlation templates. The chart can be saved, printed, and exported to an image file.
The Chart is a layout design which displays certain data from the database. It does NOT include that specific data. When you save a chart layout, you are not preventing the underlying data from being changed. The only way to truly archive a chart is to save an image of it (e.g. PDF).
Before you can create a chart, you will need to create a block template.
Combining block templates to create a chart
In the Charts module, choose File | New Chart... Choose a name and project. A new tab is created for the chart.
|
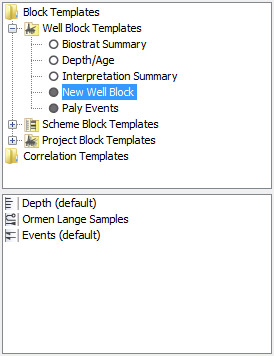
The tree now displays two folders: Block Templates and Correlation Templates. Double-click to expand the block templates folder to show the different block types; within each of these folders you will find the block templates available to add to this chart. You can add any block template from the global or the current project. Click on a block template in the tree to show its list of panels. You can also double-click on the block template to open it in a new tab. Don't forget that block template tabs have a blue background and display dummy data. Chart tabs have a white background and display data from your database.
|
 |
Drag and drop a block template onto the chart. |
|
If you drag a well or project block, you will see the Block Import Option dialog. Selecting a well will create one block based on the template, with the selected well applied. Selecting a project will create one block per well in the project, all based on the same template. Unassigned blocks have no well assigned. These can be opened in the Samples & Interpretations module. See this tutorial for notes on the 'unassigned' option. |
|

Click on a block in the chart...
- The block is given a solid outline to show it is selected.
- Any other blocks which use the same template are given a dashed outline.
- The block's template is selected in the tree.
- The properties of the block are shown in the table.
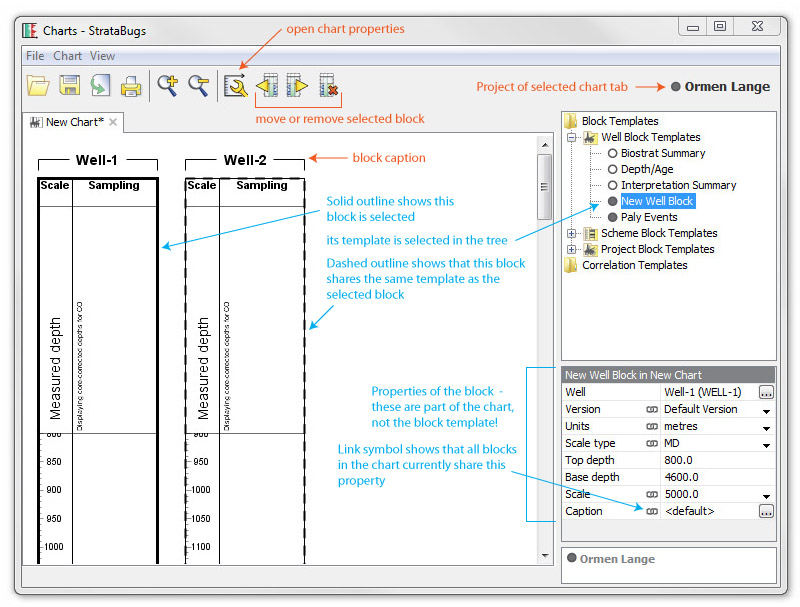
To edit the block properties, click or double-click in the right-hand column of the table.
The ![]() symbol in a property row shows that all blocks in the chart share the same value for that property. If you change the property for one block, it will update in the other blocks. To "unlink" a property, click on the symbol. It changes to
symbol in a property row shows that all blocks in the chart share the same value for that property. If you change the property for one block, it will update in the other blocks. To "unlink" a property, click on the symbol. It changes to ![]() to show that it is unlinked. This property can now be set independently in different blocks.
to show that it is unlinked. This property can now be set independently in different blocks.
Notes:
- Scale sections - in most cases the block will cover a depth or age range using one vertical scale. Sometimes however it is useful to show sections of interest in greater detail - whilst retaining the rest of the chart at a practical scale. To achieve this you can set "scale sections", which are regions of the block with different scales. These sections must be contiguous (i.e. you cannot exclude a section of the chart).
- To create a section, enter a value in the last row of the table. A new section is created above, below or within the existing section. You can now change its scale independently.
- To remove a section, you can set its scale to be the same as the neighbouring section. When you re-open the saved chart, neighbouring sections with the same scale will be combined. You can also 'overwrite' a section by making an adjacent section completely contain it.
- Well/Project - wells can be applied to all types of blocks. Well Blocks have one well, Project Blocks have all the wells in a project, and Scheme Blocks can have either one well or a project.
- Version - all panels in the block will inherit this version unless otherwise set in the block template.
- Scale type - You can set any scale type in any block; however, some scales rely on certain data being present. TVD scale requires a deviation survey in the well. Age scale requires a depth/age curve in the well version. Subsidence scale requires the well TD to be set. Even if a deviation survey or depth/age curve is present, data will not be plotted outside its range (TVD/Age is not extrapolated). Some panels rely on a certain scale type being set in order to plot anything - e.g. the TVD/Offset panel requires a TVD scale.
- The caption is plotted above the block (see diagram above). To turn off all block captions, see chart properties. Note that this replaces the "well name panel" from previous versions of StrataBugs. You can build a caption template using the Caption Builder dialog.
Chart Properties
Press the ![]() icon on the main toolbar to open the Chart Properties dialog.
icon on the main toolbar to open the Chart Properties dialog.
Adding Correlation Templates
See this page for information about (including how to create) correlation templates. You can apply unlimited correlation templates to chart. If the data in the templates is not found in the chart, no lines will be drawn.
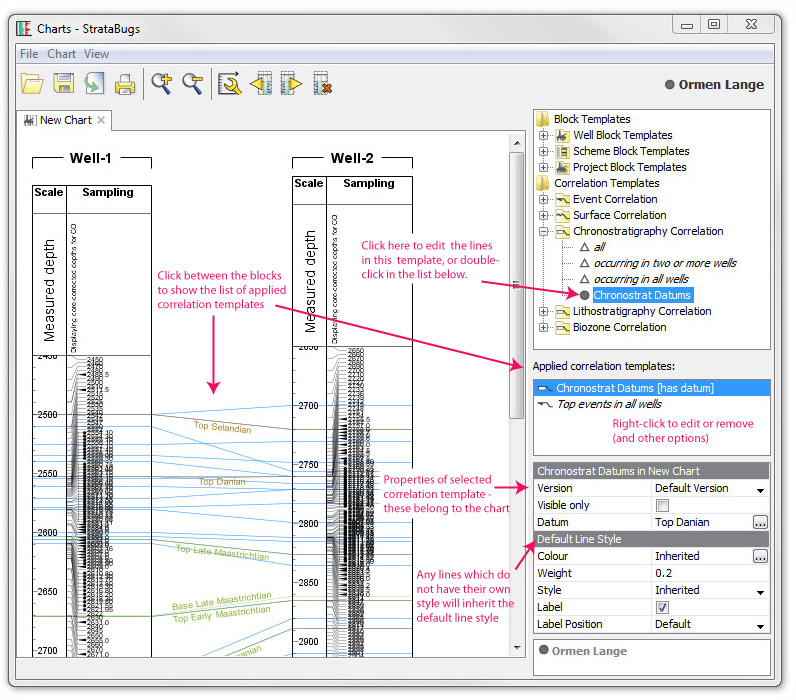
Apply a correlation template (or standard correlation) to your chart by dragging and dropping it from the tree. Click on the chart between blocks to show the list of applied correlation templates. Click on an item in this list to see the correlation properties in the table below. Click in the right-hand column of the table to edit these properties:
-
The correlation template is always applied for one version. To plot lines from multiple versions, apply the template again and choose a different version. Stratigraphic interval correlations are applied for one scheme.
Correlation lines can be drawn even if the data they are correlating are not plotted in the chart blocks. For example, you could correlation 'top events occurring in all wells' even if you are not showing an events panel. To restrict the plotted lines to only those which are showing on the chart, check the visible only box. For example, if your event panels show only palynology events, then only palynology events would be correlated.
You can nominate one correlation line from one template to be the chart datum. The blocks will be shifted up or down such that the selected correlation line is straight and horizontal. The secondary datum is used in blocks which do not contain the primary datum.
The default line style will be inherited by all correlation lines which do not have their own style set (or all the lines in a standard correlation). More information about correlation line style...
Using standard correlations
You may have applied standard correlation templates to your chart while you were working on the interpreted data. Now you wish to refine the plotted lines, pick a chart datum, and highlight certain lines with a different style. To do this, you can create correlation templates from your applied standards.
Right-click on the applied correlation standard. Choose Create template...
You can also use 'event' standard correlations to create taxon groups. This is an efficient way of creating a group for taxa linked to events which are common to a set of wells. You could use this group, for example, to filter a biostratigraphy distribution panel. Right-click on the applied event correlation standard and choose Add to taxon group...
Page last updated: 07-Sep-2015 16:43