| << Previous | Learning Trail | Contents | Section 9: Events and Composite Standards | Next >> |
| StrataBugs Learning Trail | Section 9: Events and Composite Standards |
Using the depth/age panel to create and manipulate a depth/age curve
The depth/age curve
The depth/age curve is an interpretation which defines the relationship between depth and age in a well section. It can be used to infer an absolute age in millions of years for any depth point, or to predict how deep in the section one would find rocks representing a particular age. It shows the accumulation rates for different sections of the well path. It is also used to show disconformities, which are packages of time not represented in the rock record, due to faulting, erosion, or periods of very slow sedimentation (hiatus).
Defining the curve is difficult and it can only ever be a 'best guess', based on all available information. However it can be a very useful tool which ties together all other stratigraphic interpretation. It allows you to draw your well data on chronostratigraphic (Wheeler) diagrams, which plot age on the vertical axis. You can even use the depth/age curve to create stratigraphic intervals, as explained below.
The depth/age panel type
The ![]() depth/age panel type enables you to interactively draw a best-fit depth/age curve using all relevant available data (this is the process of graphic correlation). It can be used in well block templates where is may be supported by other panels, such as wireline logs or sequence picks. The depth/age panel shows age (in Ma) on the horizontal axis, and drilled depth on the vertical axis. Events which appear in the well (at a particular depth) are therefore shown on the vertical, and can be correlated with their equivalent reference events in a composite standard (which have been assigned an age), on the horizontal. You can set the vertical axis to use a true vertical depth scale if the well has a deviation survey (this will disable the interactive features).
depth/age panel type enables you to interactively draw a best-fit depth/age curve using all relevant available data (this is the process of graphic correlation). It can be used in well block templates where is may be supported by other panels, such as wireline logs or sequence picks. The depth/age panel shows age (in Ma) on the horizontal axis, and drilled depth on the vertical axis. Events which appear in the well (at a particular depth) are therefore shown on the vertical, and can be correlated with their equivalent reference events in a composite standard (which have been assigned an age), on the horizontal. You can set the vertical axis to use a true vertical depth scale if the well has a deviation survey (this will disable the interactive features).
Build a well block template with a depth/age panel
Before you start, make sure you have the following:
- Well events - which you can to pick or generate using the Events tab on the Interpretations tab.*
- A composite standard - reference events with assigned ages. Some of your well events should appear in the composite.
- In the Charts module, create a new well block template (File | New Block Template | Well Block).
- Create a new depth/age panel template. Options for this panel are described below. Drag and drop this panel onto your template.
- Add other types of panels, e.g. depth scale, samples, wireline logs, chronostratigraphy.
- Save your block template.
- Create a new Scheme Block template. This will be used in the header of your depth/age panel. Its panels will be plotted horizontally. Include a Composite Standard panel. When you have saved this block, go back to your well block and set the header block propery in your depth/age panel template to your new scheme block.
- Open your well in Samples & Interpretations. On the Charts tab, click
 to search for and open your well block template. Use the Block Properties dialog (
 ) to set appropriate vertical (depth) and horizontal (age) ranges and scales. If the depth/age panel is not visible, check the horizontal scale range.
More detail about creating block templates can be found here.
Displaying event data for graphic correlation
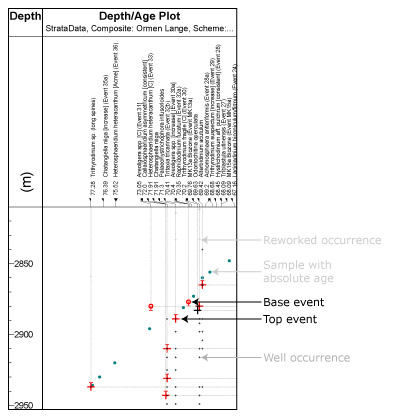
Bases are marked by circles and tops by crosses. The colour indicates the colour of the category that the event taxon belongs to (defaults to black if there is no category colour or if the event is not linked to a taxon). The "tails" on the event markers indicate the gap between it and next available overlying or underlying sample. The depth/age curve could therefore pass through these tails at any point.
Sample ages, which are entered as absolute ages directly into the samples table on the Samples tab, are shown as a green point. 'Tails' indicate the error margin if it has been entered on the Sample Age dialog. Single events such as taxon acmes or lithostratigraphic horizons are displayed as black circles with a diagonal line (not shown in the example).
Occurrences of the taxa linked to events can be plotted as small crosses. Reworked occurrences can be filtered out, or are plotted in light grey.
Moving the mouse in the chart displays a tooltip indicating the nearest sample and age to the cursor. If the cursor is near a well event, the tooltip will also display the name of the event. Similarly, if the cursor is anywhere in the vertical line below a composite standard event, the tooltip will indicate the name of that event. The grey dotted indicator lines are useful on a printed copy of a chart for tracing the names of events into the composite standard at the top of the chart and the list of well events at the side. Occurrences of taxa which appear in the composite standard are marked by small black crosses (for tops) and circles (for bases) at the age of the composite standard event and the occurrence depth.
* If you have not picked well events yet, you could do so using this chart. This would be the manual equivalent of generating events restricted to a composite. Set the composite standard and make sure that the 'Show well occurrences of composite standard taxa' option is checked on the Properties dialog. You can now see crosses and circles marking occurrences down the well; right-click at the appropriate location to add well events.
Creating a depth/age curve
-
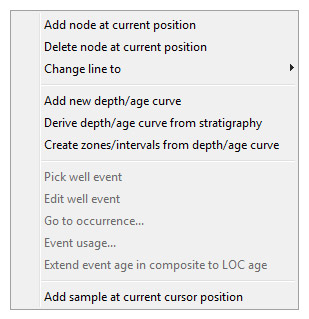
Right-click anywhere inside the chart to show this pop-up menu:
-
Select Add new depth/age curve. This creates a sloping straight line from the chart's deepest/oldest to shallowest/youngest points, passing through any sample ages you have entered in the selected interpretation.
-
You can add 'nodes' to the line by right-clicking and selecting Add node at current position at any appropriate points; in this way, you can create a line which describes the best depth/age curve, and honours the events in the well and follows best geological practice. The line can be modified simply by clicking and dragging a node to the required position. To remove an unwanted node, select Delete node at current position from the pop-up menu.
Note: these changes are saved to the database as you go along, so you don't need a separate "save" operation.
-
You can also change the line style attribute to indicate levels of uncertainty. The default style is a solid line indicating 'confident'. Change the style of any section of line by right-clicking the node on its shallower/younger end, and selecting Change line to.
There are two groups of line styles: conformable types (confident, probable, possible) and disconformable types (unconformable and fault types).
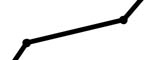
Confident
Probable
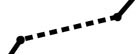
Possible
-
When you drag a node to create a horizontal line it changes the line attribute to indicate that there is a disconformity. The default style is for an unconformity; disconformable line styles also include fault types. Horizontal sections must use a disconformable line style (and non-horizontal sections muse use a conformable style). Note that where in previous versions of StrataBugs you could create unconformities using sample ages, from v2.0 onwards this method should be used instead.
Note: that although the line style is the same as used when defining interval boundaries, at present there is no cross-checking to ensure that your depth/age curve carries the same line style as interval boundaries at the same depth.
Displaying schemes
There are two ways to display the scheme:
-
Plot the scheme horizontally in the depth/age panel header. This means setting the scheme block (header) option to a scheme block (create this separately).
- Display a separate scheme block in the chart, which will be plotted using a depth scale. The depth/age curve is used to translate the ages on scheme boundaries and events to depths in the well. This will give an indication of which units, sequences or events you would expect to see down the well if the depth/age curve were correct. The scheme block re-plots as you move the curve. Note that some features will occur more than once if the depth/age curve has sections of decreasing age.
To do this you need to create a chart with two blocks: a scheme block and a well block (this one has your depth/age panel). When you insert the well block, instead of selecting a well, choose the 'unassigned (template)' option. Now open your chart in Samples & Interpretations. The 'template' well block displays the current well. The scheme block shares the same properties (depth range, scale etc) as the well block; these can be set on the Chart Properties dialog.
Displaying and using intervals
There are three ways to use intervals, depending on your approach:
-
Display interpreted intervals to aid graphic correlation
Any intervals that are linked to the stratigraphic scheme selected in the depth/age panel properties, and in the current selected version, will be displayed as a series of coloured boxes. If your intervals do not appear, check the version selected on the Interpretations tab, and the age and depth range selected on the properties dialog. The bases of the boxes will not align perfectly with the tops of underlying boxes if there are sampling gaps between the intervals. The intervals are shaded according to the colours selected for the scheme.
-
Use stratigraphy to create the basic depth/age curve
-
Use the depth/age curve to create stratigraphy
See 'creating intervals' below.
To create a basic depth/age curve automatically from existing stratigraphy right-click on the chart and select Create curve from Stratigraphy from the pop-up menu. The curve will pass through the boxes diagonally, in succession. If you have designated sample ages (indicated by blue points) then the curve will pass through these also. This quick method then gives you access to age-scaled plots which require a depth/age curve.
Example
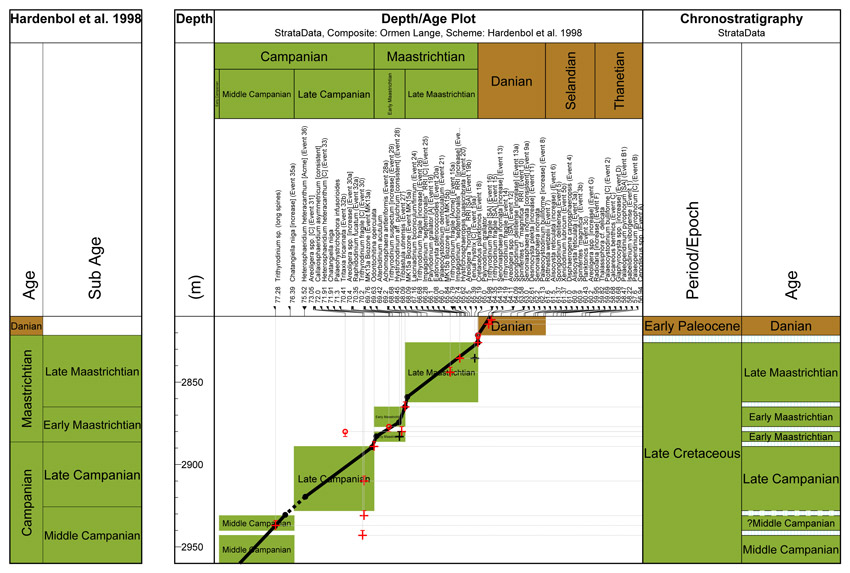
This chart shows the the depth/age curve with the well's chronostratigraphy. A panel showing the conventional view of chronostratigraphy is plotted to the right. In the depth/age panel header, the scheme is shown on a normal age scale. On the left-hand side, the scheme block, plotted to the depth scale, shows which units would be expected if the depth/age curve was correct; this can be compared with the picked units on the right.
Updating the composite
If you want to add an event which occurs in a well to the composite standard, right click on the event name in the Event list panel (you must have this displayed as part of your well block!) and select Add event to Composite. The age/CSU value of the event in the composite standard will reflect the age of the depht/age curve at the well event depth.
To adjust the age of an event in the composite to the curve age in the current well, right click on the event name in the Event list and select Extend event age in composite to curve age. You should be careful when changing the ranges of events, especially when lowering top events or raising base events, because they may have already been used in determining the depth/age curves for other wells!
Note: you will be asked to confirm that you wish to extend the range of an event, and warned if you try to shorten a range.
Creating intervals
You can create a set of intervals based on the depth/age curve and a stratigraphic scheme of your choice. Right-click and select the Create zones/intervals option to bring up the Intervals: Create dialog. Select the scheme and the levels within the scheme that you want to create.
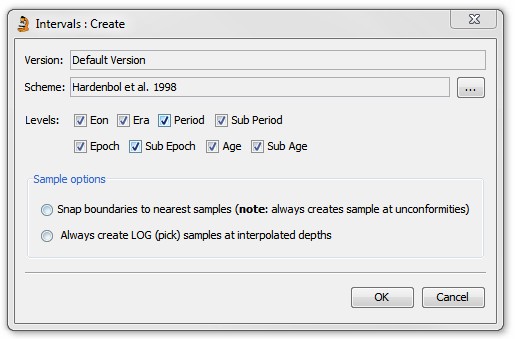
The sample options on this dialog allow you to specify whether the intervals should be created exactly at the position of the depth/age curve by creating artificial LOG samples at the exact depth point of the curve, or whether it will search up or down to the nearest existing sample, thereby creating intervals of uncertainly between samples. You would only choose the nearest sample option if your well data included a comprehensive list of samples. Note that where you have identified unconformities on the depth/age curve, these will honoured at the exact depth using a LOG sample, regardless of which sample option is selected.
Page last updated: 01-Apr-2015 15:25