| << Previous | Learning Trail | Contents | Section 9: Events and Composite Standards | Next >> |
| StrataBugs Learning Trail | Section 9: Events and Composite Standards |
Create a Project Block: Comparing a project's depth/age curves with the subsidence panel
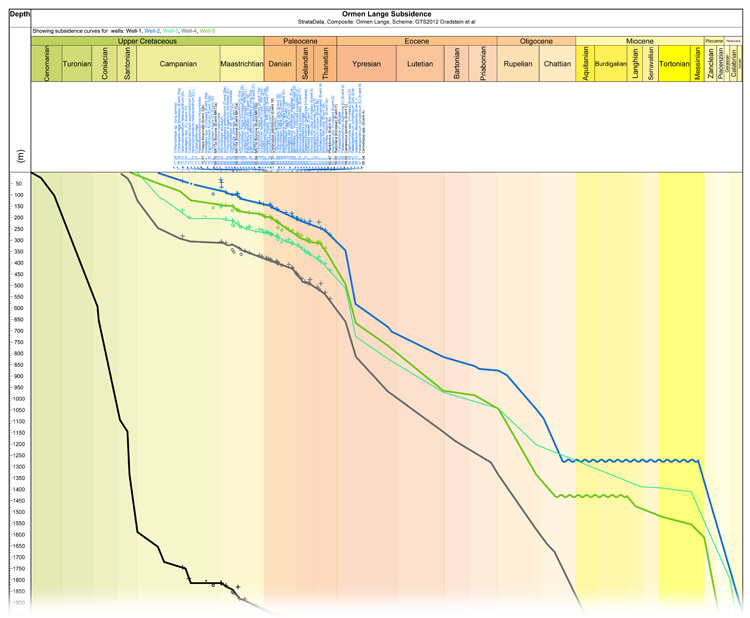
The Subsidence or Geohistory plot compares the depth/age curves for a project's wells. There are two styles available:
- Accumulation - plot depth/age curves as they defined, converting depths to TVD to make them comparable.
- Subsidence or burial history - any point on the curve represents the depth of sediment burial (or thickness of the overburden) at the corresponding age. This is calculated by subtracting the TVD at each point from the well's TD. The chart thus appears as a mirror image of a TVD/Age plot, and disconformities or condensed sections are observed as terraces on the curve.
For a successful plot, you must first ensure that:
- All the desired wells are included in the project.
- The depth/age curve for each well is defined, and in the same interpretation version for all the project wells.
- Each well has a deviation survey to convert depths to TVD (this is not essential, as drilled depths will be used where no deviation survey can be found - but drilled depths in deviated wells are not comparable on the same depth scale).
- For subsidence plots, each well must have a TD (terminal depth) defined correctly in the well header information.
Create a project block and add it to a chart
- In the Charts module create a new project block (File | New Block Template | Project block). A project block is similar to a well block, but instead of one well it is assigned all of the well from a project. Currently the only special panel available to project blocks is the subsidence panel.
- Create a new Subsidence panel template. (Right-click on the Subsidence panel type). The subsidence panel is similar to the depth/age panel in well blocks.
- Add a subsidence panel to the project block by dragging and dropping your new template. You may also wish to add a scale panel. Save the block template.
- Create a new chart. Add a project block using your template, assigning your project to it. Click on the block to select it, and set the scale type to TVD or SUBSIDENCE.
Each well in the project is randomly assigned a different colour. The well names and colours are shown in the key area of the subsidence panel header. Different line styles representing confidence level and style of disconformity are defined within each depth/age curve.
Subsidence panel properties
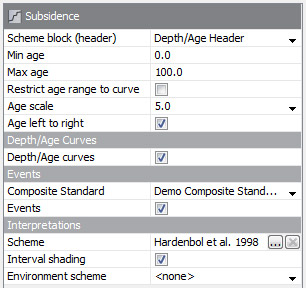 |
Set the panel's age range and scale. You may link this panel to a stratigraphic scheme. It can be any type, and need not be recorded in the well interpretations. Check the Interval shading box to plot scheme's unit colours in the background of the plot. Selecting an Environment Scheme will plot a horizontal panel under the header for each well with palaeoenvironment intervals defined. Selecting a Composite standard will allow you show well events on the chart. Only events which occur in the composite can be plotted (as this allows an age to be derived). |
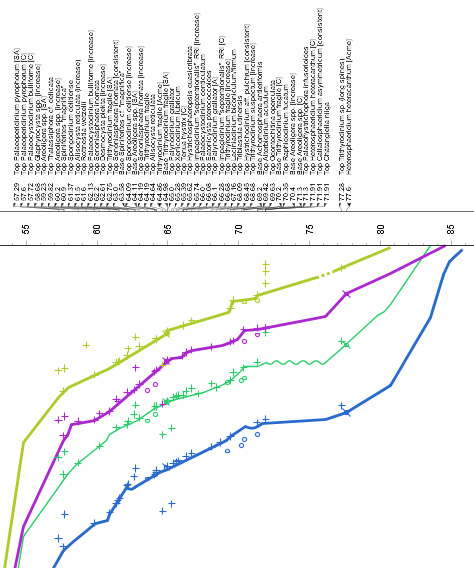 |
Events are shown as crosses (tops) and circles (bases) in the well's colour (which is randomly selected and shown in the key). Note also that the composite standard panel (here plotted in the scheme header block) has a filter option. If this is selected for the included panel template, then only events which occur in the project block's wells will be plotted in the composite standard panel. |
Page last updated: 03-Dec-2014 16:38