| << Previous | Learning Trail | Contents | Section 9: Events and Composite Standards | Next >> |
| StrataBugs Learning Trail | Section 9: Events and Composite Standards |
Create and Use a Scheme Block: Stratigraphic Range Charts
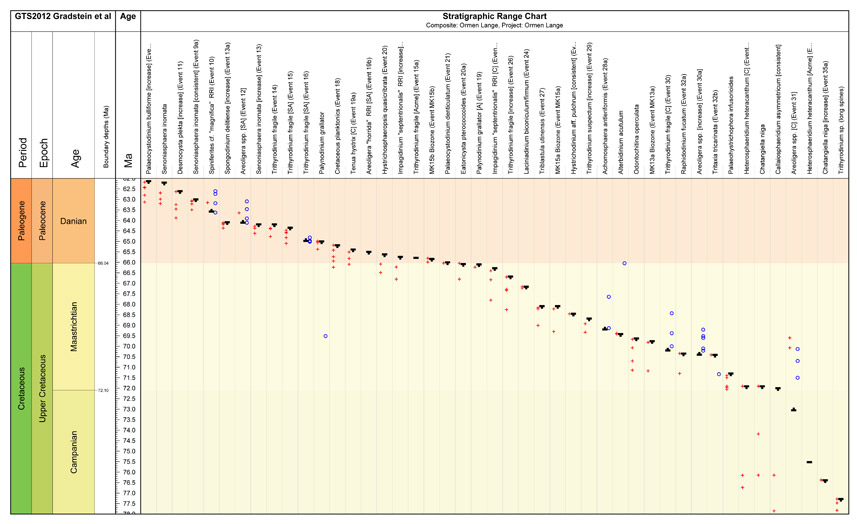
This page describes how to create and use a stratigraphic range chart for a composite standard/well project, using a scheme block template (see image below).
The Stratigraphic Range panel type displays the age distribution of taxa on which events in a composite standard are based. The panel can be used interactively to adjust the age ranges of composite standard events, and to create taxon groups. It can also plot the ages of well events from a specified project. The event age is calculated using its depth and the well's depth/age curve.
Before you start creating the range chart, you should create a composite standard. Ideally it should include both the first/top and last/base appearance events for all species. If you already have taxon groups set up and wish use them as the basis for your stratigraphic range panel, you can create a composite based on the group members by pressing the Add Group... Button on the Composite Standard dialog.
Build a scheme block template with a stratigraphic range panel
- In the Charts module, create a new Scheme block template (File | New Block Template | Scheme Block).
- You may wish or need to create a Chronostratigraphy Scheme panel template. Drag and drop this to the block template.
- Add an age scale panel.
- Create a new Stratigraphic Range panel template (using your composte standard) and drag it onto the scheme block. The options for this panel are described below.
More detail about creating block templates can be found here.
Stratigraphic Range panel options

You must select a composite standard.
Select a Group set to identify events in the composite standard which are based on taxa in groups in that set. Ideally the groups in the set should have colours assigned. A coloured square in the chart header identifies the event as belonging to that group.
You must have a set assigned to use the drag-and-drop feature to populate groups (see below).
You can sort the range chart by descending top or base of the range, or alphabetically on the event name. If you select Cluster by Group (you must have a group set selected to enable this option), events are grouped by group. Events are sorted within the groups by the same option as selected for the rest of the chart. The groups are inserted into the chart at the position of the first event.
By default, events whose range is not inside the age scale limits do not have a plotted column. Check Plot full composite to show an empty column for these events, rather than leaving them off the chart.
Images are shown in the header area. The image used is the type image for the the taxon on which the event is based.
Display a Stratigraphic Range chart
In the Taxonomic Database module, open scheme block template by pressing the ![]() icon. The chart displays in its own tab. Settings for this chart will be stored for your next session.
icon. The chart displays in its own tab. Settings for this chart will be stored for your next session.

Use the Chart Properties dialog (![]() ) to assign a project to the chart. The project's wells are scanned for well events which are based on the same dictionary events as events in the composite standard. The age of any matching events is calculated using the well's depth/age curve, and the event is plotted as a red cross (tops), blue circle (bases) or grey line (single) in the appropriate column on the stratigraphic range panel. Only events and depth/age curves in the selected version are used.
) to assign a project to the chart. The project's wells are scanned for well events which are based on the same dictionary events as events in the composite standard. The age of any matching events is calculated using the well's depth/age curve, and the event is plotted as a red cross (tops), blue circle (bases) or grey line (single) in the appropriate column on the stratigraphic range panel. Only events and depth/age curves in the selected version are used.
You can also use the chart properties dialog to set an appropriate age range and scale. On the Colours tab, choose your chronostratigraphic scheme to provide background shading colours.
Interact - edit event ranges
- Make sure the interactive toggle (
 ) is selected.
 - Hover the mouse near an event. The curser changes to a hand and the name of the event appears in bold in the tooltip.
- Click and drag to move the event up or down. The age at the cursor point shows in blue. You can drop it anywhere in the range panel.
- The event is updated and saved in the database when you drop it.
- You can undo these edits using the undo button (
 or Ctrl+Z).
You can also edit events by double-clicking on them to show the Composite Standard Event dialog.
Where the composite has a top but not a base, you can double-click anywhere below the top to add the base at that age. Likewise, double-click above a base to add a top.
By default the chart will not re-sort the the events immediately after you edit a range; therefore the ranges may become out of order if you edit them. You can re-sort the events at any time by toggling the interactive button (![]() ) off and on again.
) off and on again.
Interact - create groups by drag-and-drop
- (If you have already created a group set and assigned it to the range panel, skip to step 4). Create the groups you wish to populate in the normal way. It helps to assign colours to groups (double-click in the colour column of the groups sidebar). Open the group windows.
- Create a group set containing the groups.
- Assign the group set to the stratigraphic range panel template via the charts module (you can jump straight here using the
 icon). Save the panel template.
 - Click and drag the event name in the chart header, and drop it over a group window. A coloured square now appears in the chart header to indicate group membership.
- If you have the 'cluster groups' option selected, a rectangle in the group colour shows around the individual events to indicate the overall range of the group.
Note: you can omit step 3 and still be able to drag and drop species into groups, but you will not see the group colours appear on the range chart unless you assign a set to the chart.
Page last updated: 03-Dec-2014 14:59