| << Previous | Learning Trail | Contents | Section 7: Charts | Next >> |
| StrataBugs Learning Trail | Section 7: Charts |
Chart Properties dialog
Use this dialog to edit the general properties of a chart. Open it using the ![]() icon.
icon.
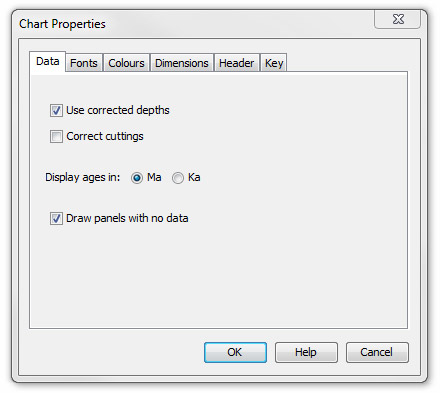
Data tabUse corrected depths to show loggers' depths for core (CO) samples. You can extend this behaviour to correct cuttings if you wish. See this page for more information about 'core to log shift'. Note that there is also an option in the samples panel to plot unshifted sample depths. It may be more appropriate to display ages in Ka (your database stores ages to the accuracy of 1 year). In v2.1 block templates are designed without a data context. When you use the template in a well context, there may be panels which do not show any data. To maximise the reusability of block templates, you can choose whether or not to draw panels with no data. |
 |
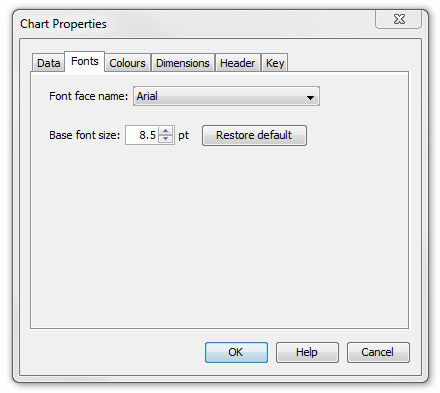
Fonts tabAll text in the chart is scaled from one base font size. If you want to display slightly larger (e.g. for a poster) or smaller (e.g. for book) fonts, you can scale just this value. The default is 8.5pt (3mm). This is designed to be readable on screen. Note some panels have options to use small, normal or large font size. These sizes are still scaled from the base font size. When the base font size is 8.5pt, small fonts are 7pt, large fonts are 11pt and header font is 14pt. |
 |
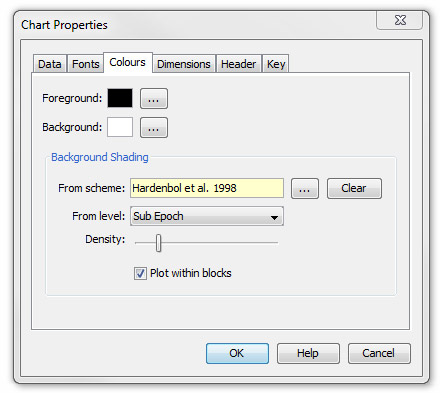
Colours tabThe background shading is derived from the from data in the chart. It can be plotted just between blocks or as a background to the whole block. To see colours, the plotted wells must include intervals which are formally linked to units in the selected scheme. The hierarchy level relates to the scheme, not the intervals. Any linked units which are above this level will be plotted. Note that the chart does not have to contain a panel plotting these intervals, and that this setting is independent of correlation lines. Select greyscale to convert all colours to shades of grey. |
 |
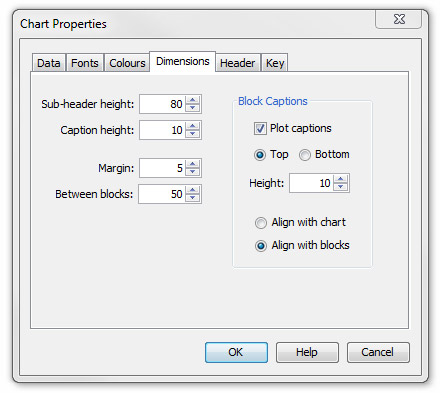
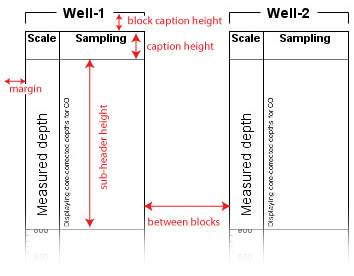
Dimensions tab
*The extended caption height will be absorbed in the sub header, the overall panel caption height is the sum of the sub-header and the caption height. Note you can change the block caption by clicking on a block to select it and editing the block properties table. |
 |
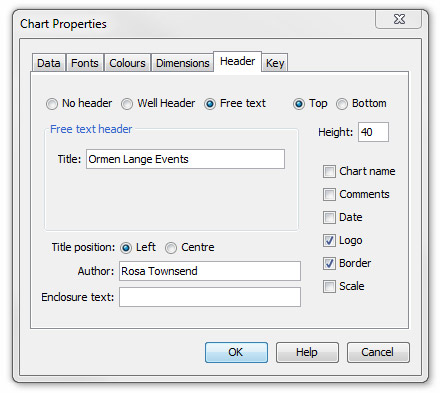
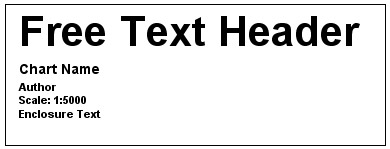
Header tabWell header information will only be shown where the chart includes only one well. To include your company logo on the chart, place a jpg file called "logo.jpg" in your StrataBugs folder. This file must use RGB colour space. The diagram below shows location of free text items.
|
 |
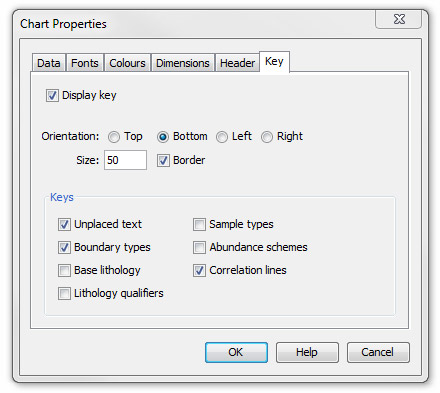
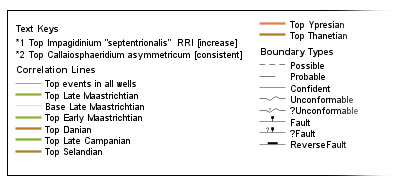
Key tabOverspill text can be plotted in the chart key. If you save or print the chart, the text keys will always be correct. When viewing the chart on screen, you may see an * without a number, or an incorrect number of items in the chart key. This is to make the on-screen charts more efficient.
|
 |
Page last updated: 29-Jan-2019 15:03