| << Previous | Learning Trail | Contents | Section 7: Charts | Next >> |
| StrataBugs Learning Trail | Section 7: Charts |
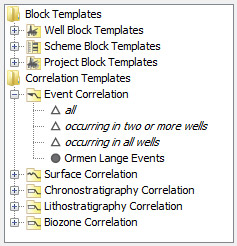
Correlation Templates
|
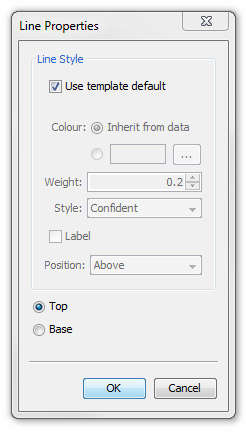
A Correlation template consists of a list of correlation lines, each one based on a correlatable data object of a certain type. Correlatable objects are events, surfaces, and the top and bases of stratigraphic intervals. Each line may have its own drawing style. You can apply many correlation templates to one chart. With a chart tab open, the tree shows a folder for correlation templates. Below this is a folder for each correlation type. Expand a type to see available templates. The templates with the open triangle symbol are 'standard correlations'. Other templates may display the 'global' or 'project' icon, and may also show a locked icon if they are set to read-only. |
 |
Applied correlations, their properties and the chart datum
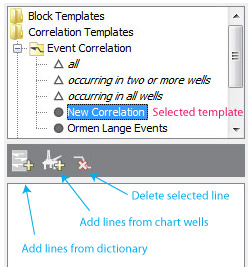
When viewing a chart tab in the Charts module, you can click between blocks to see a list of the applied correlation templates. Selecting one item from this list shows the properties of that correlation in the table below (double-clicking on an item lets you edit the correlation template). From here you may select one correlation line from one template to be the chart's datum. See here for more information.
Standard correlations
The standard correlations are designed to give you a very quick view of how your wells correlate. When you add a standard correlation, the chart will create correlation lines for items which occur in 'all wells', 'two or more wells', or 'all' of the items. As you edit the underlying data, the standard correlations will be updated with new correlation lines.
Standard correlations cannot have individual line styles and they cannot be used to contain the chart datum. They are designed to be used as a temporary tool, to help you decide which items worth adding to a final correlation template.
Creating and editing a correlation template
Page last updated: 07-May-2015 10:15