| << Previous | Learning Trail | Contents | Section 9: Events and Composite Standards | Next >> |
| StrataBugs Learning Trail | Section 9: Events and Composite Standards |
Graphic Correlation in StrataBugs
Note: this page is not intended to be an exhaustive discussion of the graphic correlation method; it outlines the concepts involved and how they are related to StrataBugs. See this page for tutorials and examples.
What is graphic correlation?
- Graphic correlation is a technique for comparing two well/outcrop sections and highlighting potential points of correlation.
- The basic premise is that there are identifiable events (e.g. first appearance of a species) in one section which are time-equivalent to the same events in another section. These can be plotted on a simple cross-plot diagram.
- You could compare two well/outcrop sections, one on each axis. If the sections represent identical time periods and have identical, continuous sediment accumulation rates, the line of correlation would be a straight line.
- Alternatively can compare one well/outcrop section with a known standard defined in age, in order to establish the age/depth profile (the 'depth/age curve') of the section.
- The known standard, or "composite standard" represents the maximum observed stratigraphic range of events. It should not be considered a static entity, rather it should be continually refined and added to...
- ...up to a point. A composite standard may be more useful when it refers to a restricted geographical region. Global standards could have very large stratigraphic ranges, in which case their predictive properties would be limited when working in one region.
- Graphic Correlation is NOT a "black box", in which data is processed and a result comes out. The biostratigrapher must make judgments about the relative importance of different events.
How can StrataBugs help?
StrataBugs can plot a well/outcrop section against a composite standard (but not against another well/outcrop section).
- It enables you to handle a lot of raw data in an organised way.
- Some parts of the process can be automated (e.g. generating events).
- The interactive depth/age panel lets you draw depth/age curves for any well/outcrop section in your database, drawing on all supporting data.
- It lets you easily update your composite.
- There are tools to help you quality-control
What does graphic correlation look like in StrataBugs?
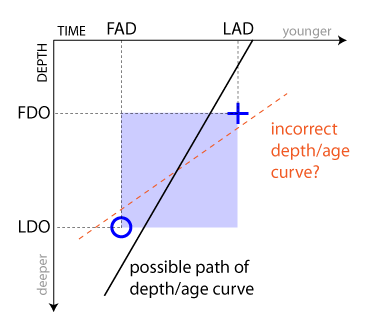
- The depth/age panel plots depth on the y-axis (increasing downwards), and time on the x-axis (by convention increasing right-left, but can be changed).
- If the panel has a composite standard is selected, any events which are picked both in the composite and in the well are marked on the chart. Crosses show top (FDO/LAD) events and circles show bases (LDO/FAD events).
- If both the top and the base are shown, you could imagine a theoretical boundary for the section's depth/age line (shown in light blue in the figure). If we assume that the composite standard represents the maximum stratigraphic range of this event in this region, then we can say that the top in our well must be the same age or older than its top in the composite. Likewise, the base in our section must be the same age as or younger than the base in the composite.
- Thus the line must pass to the left of the tops and the right of the bases (or vice-versa if the x-axis is scaled in the reverse).
- However, the composite standard may not be complete! If you are fairly sure about other points on the depth/age curve, and you are sure about the well event itself (is the species identified correctly? how good was the preservation? are you sure it wasn't reworked?), then you could extend its range in the composite, by projecting onto your current line.
Where do I start if I don't have a composite standard?
- You may be working on a project with a number of wells in one geographic region. Defining an age/depth relationship for each well will help you to correlate them... But if you don't have a composite standard for the region, where do you start?
- Set up a well block template in your project which includes a depth/age panel template (the panel template should also belong to the project). You need to decide on its overall age range - perhaps you have already defined biozones or chronostratigraphic intervals which will help you arrive at the figures. Set the panel template's x-axis to this range. Leave the panel template's composite standard blank.
- Choose one of the well sections as a starting point. It should be, to the best of your knowledge, the most complete section; i.e. it should be well sampled, contain many different species, and have no (or at least well-known) faults or hiatuses. Open this well in Samples & Interpretations, and open your well block in the charts tab.
- Then create a new depth/age curve using the pop-up menu on the chart tab. At this point you can use any data that you already have to define the rough shape of the line. For example, if you know the age above/below an obvious fault, you can define this. You may also have had some samples dated, or defined biozones or chronostratigraphic intervals.
- If you haven't already done so, define or generate top/base events for your species occurrences. You can also use abundance events like acmes or consistent occurrences. Make sure your final list of events contains only those you believe to be significant.
- Now go to the Interpretations/Events tab. Press "Composite" to add a new Composite Standard, based on the events you have picked and their ages as derived by the depth/age curve you have defined. You will continue you refine this composite as you continue the process. Assign this composite to your depth/age panel template.
- Now choose the next best section and open the depth/age well block template. Define the depth/age curve using the cross-plot of events and any other data you have.
- You can now refine your original composite: you may be able to add new events to it (ones which weren't in section 1) - right-click on the events panel and choose "add events to composite"; you could also extend the range of its existing events.
- Go back to your first section. What does the depth/age plot look like now? Can you refine it?
- Repeat the process with other wells in your project. Your composite should become more reliable as you compare it with more and more well/outcrop sections.