| << Previous | Learning Trail | Contents | Section 7: Charts | Next >> |
| StrataBugs Learning Trail | Section 7: Charts |
Concepts Overview
This page gives an overview of the concepts behind the v2 Charts module.
Anatomy of a Chart
A StrataBugs Chart consists of one of more 'panels', which are arranged within 'blocks'.
There are different types of panel available to display the different StrataBugs data types; e.g. a Samples panel which displays the sample list, or the Vertical Section panel which displays the path of a horizontal well section. Each panel type has display options or properties which can be customised by the user.
A block is a collection of panels. The block has a set of properties which affect all of its panels. These properties include the scale range (e.g. minimum and maximum depth) and the scale type (e.g. measured depth or age). Different types of block include Well Block and Scheme Block. Most panel types only plot in one type of block; e.g. the samples panel can only be added to well blocks. The properties for a well block include the well to be displayed.
A chart may consist of one or more blocks. The blocks could display different wells. The chart itself has a set of properties, including the font size and style, header and key panels, and the size of the gap between different blocks.
The chart may also include one or more 'correlations', which are overlaid on the blocks.
Templates
All components of the chart are based on templates (panels, blocks and correlations). The link to the template is maintained such that if you change the template, then any part of any chart based on that template will be updated. Using this dynamic template system:
- Cuts down on duplication in the database so you have fewer chart components to maintain
- You can very quickly create large correlation charts
- You can easily edit a repeated component in a large chart
- You can easily create and manage your own personal or company chart style
- The chart materials for a project develop alongside the data
v2.1 dynamic chart templates are a fundamentally different to the concept to chart templates in previous versions of StrataBugs. Users who are familiar with the old template concept should be doubly aware that editing a template could affect many charts.

|
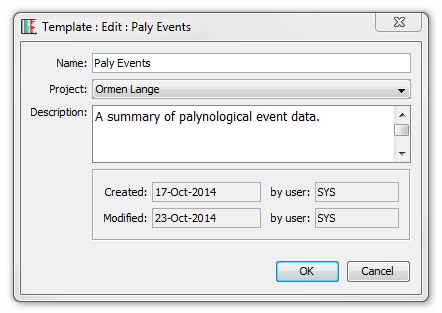
All types of template can be given a name and description. The audit information (date created/modified and user who created/modified) is recorded for each template. The name should be easy to identify, and the description can be used to record more detailed information about what the template is designed to display. |
Projects
All templates must belong to a project. You cannot mix templates from different projects in one chart except for templates which are for general use and which belong to the 'global' project. For example, a chart in the project 'Training' can only contain block templates from the project 'Training' and "global" block templates. A chart or block template can only display wells from its own project.
Typically you will create a set of project-specific panel and block templates, which might be re-used several times within that project. They are hidden from the display when you are working on a different project.
Panel and block templates which you use regularly can belong to the global project. These are always accessible but because they are commonly used, they might be edited only occasionally. You can quickly create new panel and block templates by copying from standard global templates, and then refining to suit the specific needs of the current project.
Permissions
Panel, block and correlation templates, and charts, can be set to an uneditable 'read-only' state by a superuser or key user. Read-only templates display the ![]() symbol. You can edit the permissions of a template by right-clicking it in the tree and choosing Permissions... More about permissions...
symbol. You can edit the permissions of a template by right-clicking it in the tree and choosing Permissions... More about permissions...
Page last updated: 01-Mar-2016 13:09