Using StrataBugs for Biosteering (charts with template blocks)
The ![]() TVD/Offset panel template type is used to display horizontal well paths. You can record data from a deviated well and use it to predict ahead of the drill bit for the purposes of biosteering or 'horizontal' drilling. Plotting a well which deviates significantly from the vertical creates a unique set of geometric problems when trying to plot analyses in two dimensions on screen or on paper.
TVD/Offset panel template type is used to display horizontal well paths. You can record data from a deviated well and use it to predict ahead of the drill bit for the purposes of biosteering or 'horizontal' drilling. Plotting a well which deviates significantly from the vertical creates a unique set of geometric problems when trying to plot analyses in two dimensions on screen or on paper.
This tutorial describes how to use the TVD/Offset panel in a well block, and how to create a 'template block' in a chart to open in Samples & Interpretations.
You should work within one project: all wells and chart templates should belong to this project.
-
Create a reference well section or 'motherbore'
A reference section or "motherbore" is usually set up ahead of the drilling of a deviated well. This can be a real well or based on the results of a pilot study. Typically this will involve the study of cuttings and cores from previously drilled wells above and below as well as within the target horizon. Set up the motherbore exactly as you would a normal well. It should include all the reference points that you will need when analysing samples from the deviated or "lateral" wells. Add all biozones (or lithostratigraphic intervals) you will need the refer to in the usual way. The scheme used will be enhanced by information from new wells.
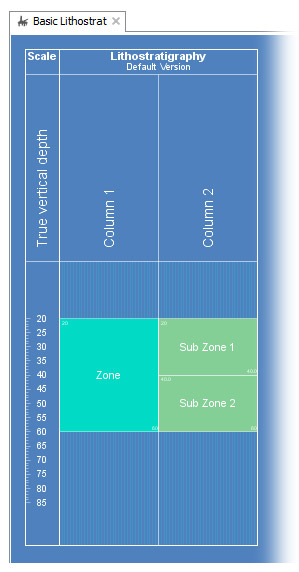
In the Charts module, create an appropriate well block template for this well - including panels for biozones or lithostratigraphy.
-
Create a deviated or 'lateral' well
Again, the deviated well should be created in the normal way.
The lateral well must have a deviation survey. Input this data via the Deviation Survey dialog, which you can open through the Wells & Outcrops module. Here you can read the survey data from a file or enter it manually.
You can also read in a planned deviation survey on the Deviation Survey dialog. This can then be plotted on the chart alongside the actual data.
To keep the data up-to-date, make sure that you:
- Add samples as they become available
- Continue to add interpretations (intervals) to the deviated well
- Update the deviation survey data periodically
-
Create a well block for the deviated wells
In the Charts module, create a new well block. The block must include a TVD/Offset panel - you should create a new panel template for this which belongs to your project.
The properties for this dialog are explained on this page.
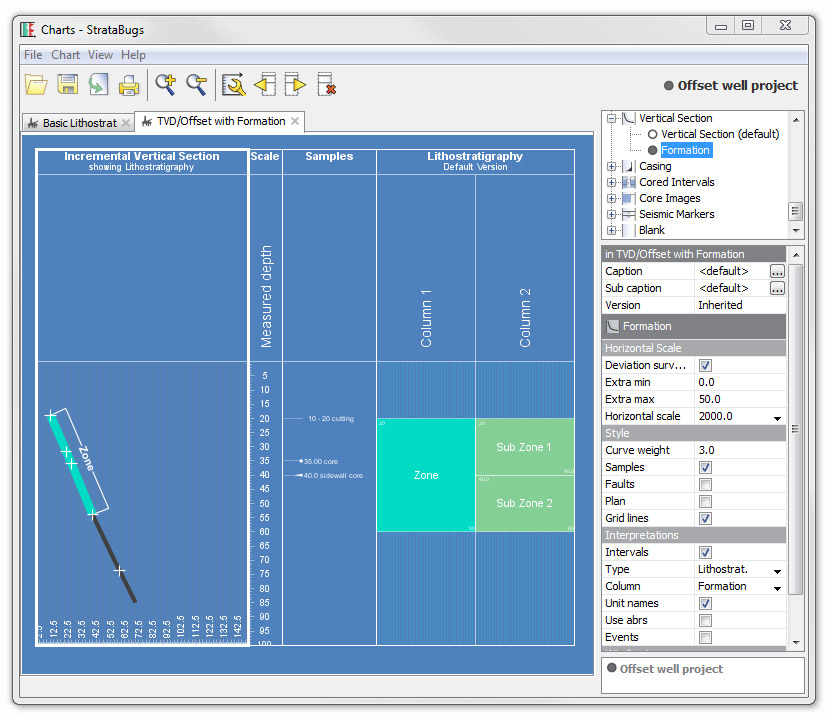
Open the deviated well in Samples & Interpretations. On the charts tab, open a tab for your well block template. You will need to set the scale type to TVD before data will show on the TVD/Offset panel. This image shows part of Lateral-3 in the demo database, with lithostratigraphy and unit names plotted:
-
Create chart with an 'unassigned' well block
In the Charts module, create a new chart. Add a block for the motherbore using the first well block template you created. Assign the motherbore well to this block. Set the scale type to TVD and the scale range as appropriate.
Now add a block for the deviated well using the second well block template you created (which includes the TVD/Offset panel). Instead of assigning a specific well, choose the "template" option:
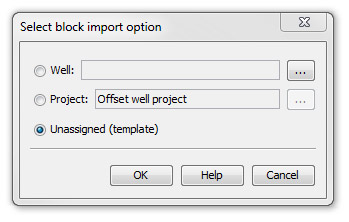
The block is plotted on the chart showing the dummy 'template' data. You cannot change any of the block properties except the caption. Save your chart.
Open the chart for each deviated well in your project in the Samples & Interpretations module. The 'unassigned' block is given the current well and version. You can now change the block properties using the Chart Properties dialog.
Project the path of the lateral bore
On the basis of of your analyses and the well prognosis you can project the path of the lateral bore. A vertical dotted line at the end of the panel shows the point at which the deviation survey data ends. Right-click anywhere to the right of this line where you want to project the well path, and select Project well path to here from the pop-up menu.
To give yourself more space to the right of the dotted line, change the panel properties from the Charts module.
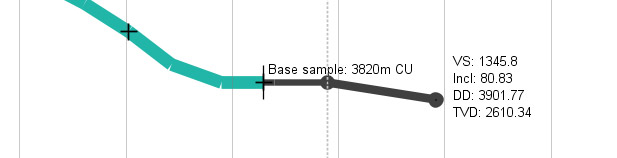
The well path is now projected past the end of the deviation survey and gives you the vertical section, inclination, drilled depth and true vertical depth of the projected point. You can move the point around by clicking and dragging it to a new location. If this point is later drilled, you can add it to the well's deviation survey by right-clicking on it and selecting Add this point to deviation survey.
If you want to remove the projected point, right-click it and select Clear projection.
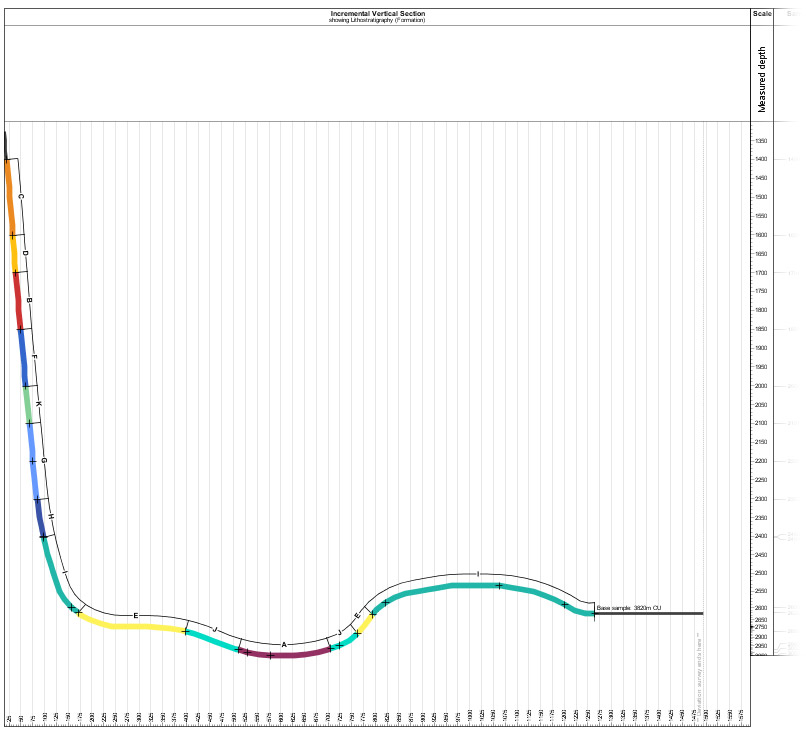
Note: The TVD vs Offset panel shows the incremental vertical section view. This is not necessarily the same as a planar section view because the total offset distance is the sum of all the incremental steps, regardless of direction (or azimuth). The incremental vertical section view is a composite of the planar views for each section (row of deviation survey) in the well.
The colours on the curve indicate the recorded unit at that drilled depth. The thinner black line shows the curve where there are no recorded intervals. If the units of your scheme do not have colours, or the colour is white, the curve shows as a thick grey line. This well has no planned deviation survey; if you do choose to plot one, it will show as a thin black line. As you hover your cursor over the chart, the TVD and VS of the cursor point show in the bottom-left corner of the screen. If you hover over the path of the well, the drilled depth also shows.
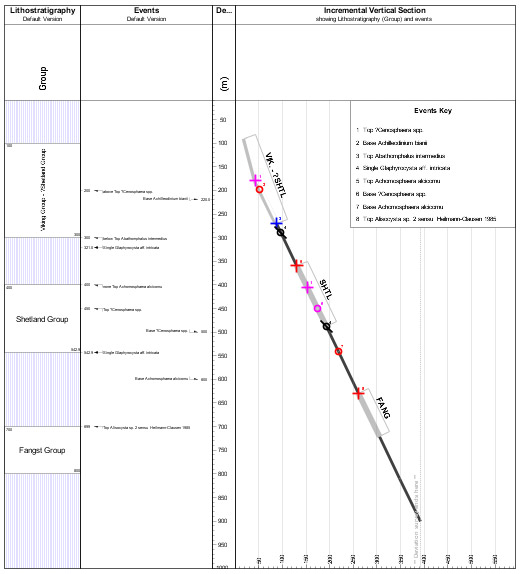
The example below shows a deviated well with events and lithostratigraphy.
Page last updated: 01-Dec-2014 12:11