TVD/Offset Panel Properties
The TVD/Offset panel shows the vertical section path of a offset well. To show data in this panel, you must have a deviation survey entered for the well, and show the chart on a TVD scale. More on using this panel...
 |
Horizontal ScaleCheck the box to use the full range of the plotted well's deviation survey. Set extra space at the left and right hand sides using the next two options (you will need extra space at the maximum end of the scale to plot the predicted path of the well). If you prefer to set the horizontal range yourself, uncheck the box and set the minimum and maximum as appropriate. StyleSet the weight of the curve line in mm. A deviation survey for the planned path can be loaded alongside the actual deviation survey, and plotted on the panel with a dotted line. Load this data on the TVD dialog. Vertical grid lines are optional. |
Samples show as small black crosses on the curve; faults are marked with a symbol and the fault throw (this feature may be enhanced in future versions);
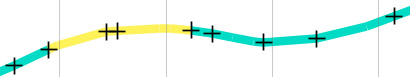 |
Example of samples plotted on the curve. |
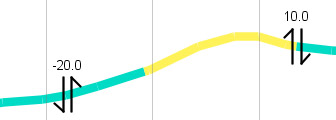
| Example of faults plotted on the curve. |
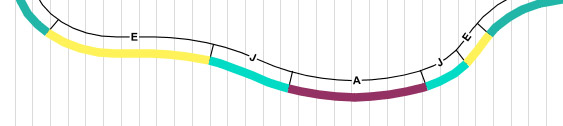
Interpretations
Intervals |
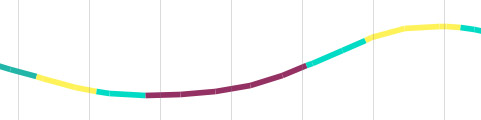
If this box is checked, the line representing the path of the deviated well will be coloured to show the location of interpreted units of the type selected. The intervals will be taken from the panel's version - this is an attribute of the well block and may be set explicitly or inherited from the block.
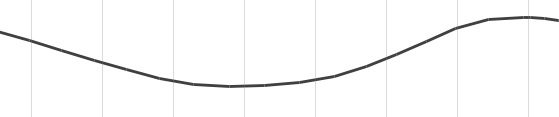
If the box is unchecked, the line will show in black only:
|
Column |
You may only show one column of stratigraphy on the curve. The column mapping for any well and version is under your control: use the Column Mapping dialog in on the Interpretations tab in Samples & Interpretations. The panel properties shows all available hierarchy levels for the interval type; in a well context, the column which includes this level will be selected. For example, if your lithostratigraphy is mapped into two columns 'Group/Formation' and 'Member/Bed', you can select Member OR Bed in the panel properties to plot the second column. If you wanted to show all the lithostratigraphy in one column, you could map all levels into one column. |
Unit names |
Check this option to display the names of units above (on the shallower depth side) of the curve. You may display either the full unit names or their abbreviations. If you select abbreviations and none exist, names will be used instead. Edit unit abbreviations from the Schemes & Interpretations module.
|
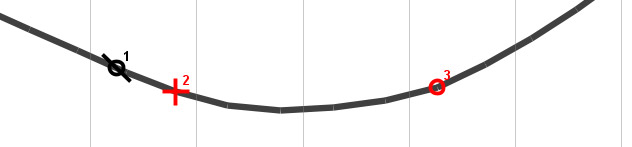
Events |
Check this option to display events along the curve. Events are plotted as a cross (tops/FDO), circle (bases/LDO) or circle with a line through (single events), in the category colour of the taxon to which the event is linked. The label style you choose may depend on the shape of your curves - horizontal labels will not display well on horizontal curve sections, where the key option (below) will be clearer. If you opt for the key option, the events are numbered in the order they appear down the well (with repeated events sharing the same number).
|
Wireline Logs
Trace |
You can display two wireline log traces together on this chart. Select from the all available types using button in the table. To add traces to this well, use the Wells & Outcrops module. By default, the log will be plotted with the default style settings for its type. You can change these defaults in the Control Panel Config menu. You can make a one-off change to the style settings for the traces in this panel by pressing ... in the properties table next to the trace you want to change. Note that not all of the properties on the dialog will have an effect on this chart; you cannot wrap the trace or use filled trace styles. Note from the diagram below that the trace is drawn in straight sections, which are not distorted to follow curves in the well path. Thus, where there are curves, sections of the log trace may not join up, or may overlap. Plotting the scale centre line helps to show this effect. |
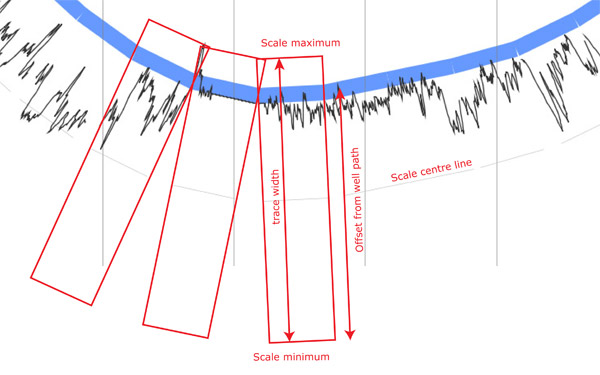
(trace) width |
An arbitrary number defining the on-screen distance between the minimum and maximum values of the trace. The default is 40. |
Offset (from well path) |
An arbitrary number defining the on-screen distance between scale minimum and the well path. If you want the centre of the scale to lie along the well path, set this value to half of the trace width. Setting the value to 0 will make the trace appear "above" the curve. |
(depth) shift |
As with a normal wireline log panel, you can set a depth shift to alter all wireline log values. |
| Line at scale centre | The grey line at the centre of the scale gives a guide to the scale as well as showing how sections of the trace may not connect or overlap (see above). |
Page last updated: 01-Dec-2014 12:13