Column Mapping dialog
This dialog enables you to assign the levels in a scheme hierarchy to columns for plotting on a chart and to edit the column title names. You can open the dialog in Samples & Interpretations, on the Interpretations tab, by clicking on the Column Mapping button above the chronostrat, lithostrat or biozones tables.
Note that the default column names are a system-wide preference, which can be edited by a super-user.
Columns are vertical divisions of panels in plotted charts. The set of Levels is specific to each scheme type (e.g. chronostratigraphy schemes have 8 levels, from Eon to Sub Age). You may not wish to plot every level as a separate column in charts; this dialog allows you to select which levels will be plotted in which columns. Column mapping is specific to each data type in each well and is stored in the database.
|
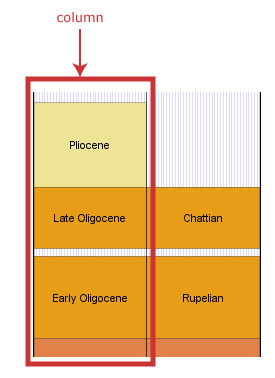 |
The preview shows how the scheme's levels will be plotted. Each column is outlined in red. The column titles are also shown in red. In this example, the Period/Epoch column contains the first six levels and the Age column contains the last two.
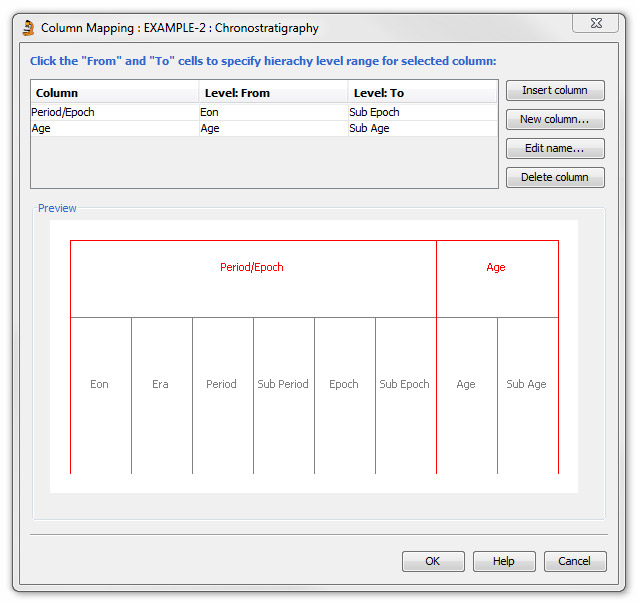
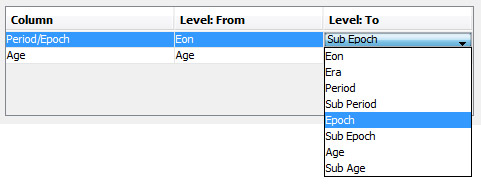
Use the table to change the levels which appear in a column. Click in a Level cell to show a drop-down list of scheme levels. All levels must be included in a column. When you change a column's level range, subsequent columns are reshuffled to include all levels.
Example: In the above example, to move the 'Sub Epoch' level into the 'Age' column, click in the Level: To cell for the Period/Epoch column to show the drop-down list of levels, and then select Epoch. This removes the Sub Epoch level from the Period/Epoch column and because it must be included in a column, it is automatically added to the next available column (Age).
Use the buttons to Add new columns, Insert new columns above the selected column, Rename or Delete columns.
Page last updated: 24-Nov-2014 16:42