Printing Charts
StrataBugs charts can be printed on a device of your choice. There are some options you should be aware of to get the most out of your printed charts.
How to print the chart
You can print all charts in StrataBugs.
- Select the chart.
- In Samples & Interpretations, select the appropriate chart tab and click File | Print | Chart...
- In the charts frame in Schemes & Interpretations or Taxanomic Database, press the
 icon.
icon. - In Charts, press the icon (note that you cannot print block templates).
- Select printing device
- View print preview and review print settings
- Print the chart
Tile or shrink to fit?
-
The Tile option prints the chart at the natural scale (which you can set on the chart properties dialog, see below). The chart's depth scale will be correct (e.g. if the scale is 2000, every 2000mm in the well is represented by 1mm on the chart). The chart image may be very large and will be tiled across as many sheets of paper as necessary.
On the print preview dialog, dotted cyan borders show the outline of the pages which will be printed with your selected page options. Don't forget there will also be a white margin around the image on each page!
-
The shrink to fit page size option scales the chart image to fit within the printable area of the page you have selected. This is the equivalent to zooming out in the chart window. If the chart fits within the printable area of the page it will be printed at the natural scale (not zoomed in).
Fitting more on the page
When designing a chart template you should have in mind where it will be displayed: for example, on-screen in StrataBugs, in presentations, in printed reports or as a large-scale print. You should consider the following options for getting as much data as possible on the page and it still being readable.
-
Chart scale, depth range and panel widths - to fit more data in the same space without making the fonts and labels unreadable, you should change the chart's scale (not font size). You can set the scale in the chart's Chart Properties dialog. You may also wish to restrict the depth range so that you do not plot areas with no data. You can save space in panels by adjusting their widths - you might wish to create "compact" panel templates for use in small charts.
-
Font sizes - the default font sizes are designed to be readable and economical at the 1:1 zoom (i.e. printed at the natural scale). If you choose the 'shrink to fit page' option, it is tempting to change the font sizes to accommodate for the 'zooming out' effect. You should avoid this as much as possible by adjusting the chart's scale instead.
All font sizes are scaled from a base size. This means you can easily adjust the size of all text together. "Normal" size font uses the base size, which is by default 8.5pt - readable on screen and on paper. Some panels also let you set their relative font size. It may be necessary (and appropriate) to adjust the font sizes if you cannot read the smallest text, or if you are printing a very large or small chart. If you increase the sizes, text may either overplot the edges of the panels, be truncated, or not plot at all.
Paper size and margins - Press 'Properties' on the print preview dialog to show the Page Setup dialog.You may find the chart fits better with a landscape orientation. The default page margins are typically large - you can fit much more chart on each page by reducing them (and some printers support 'borderless printing' with no margins at all).
Example
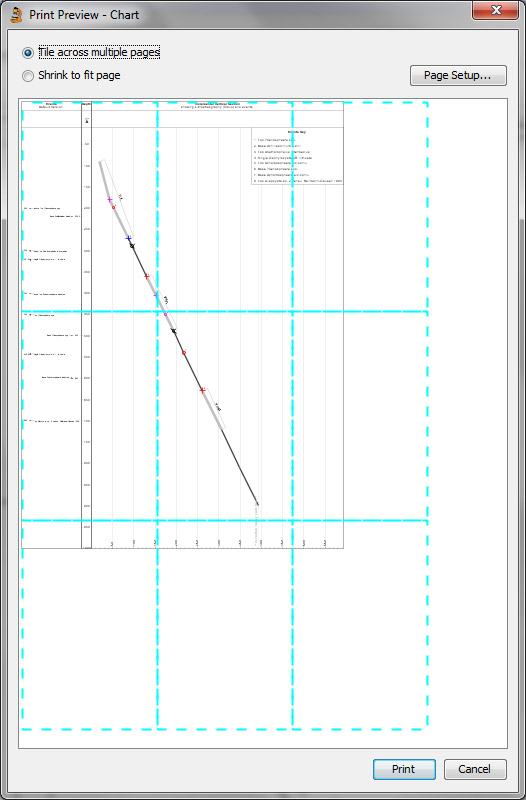
This chart would print accross 9 A4 pages if the default settings were used.
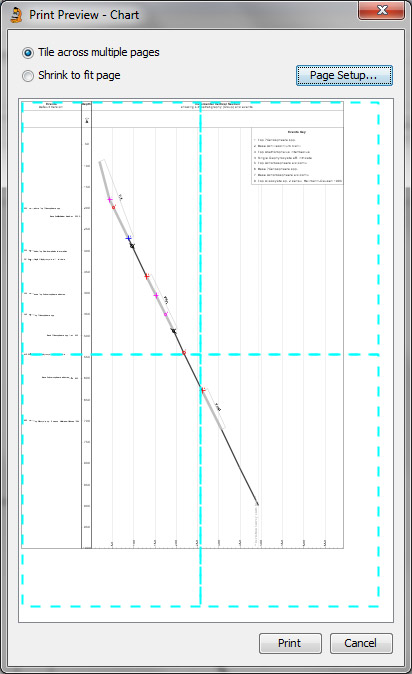
This is easily reduced to 4 pages by redcing the page margins.
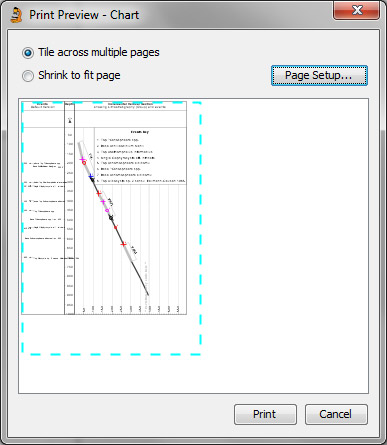
The chart fits on one A4 page when its scale is changed from 2000 to 4500, and the width of the Events panel is decreased from 70 to 50.
Page last updated: 12-Aug-2014 12:13