| << Previous | Learning Trail | Contents | Section 6: Interpretations | Next >> |
| StrataBugs Learning Trail | Section 6: Interpretations |
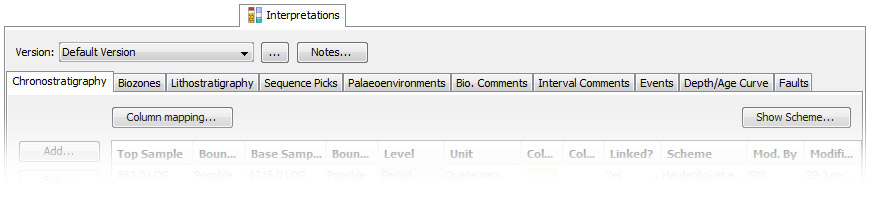
Interpretations tab
This tab is the main location for viewing, adding and editing interpretations made from biostratigraphic data, as well as other ancillary geological information such as lithostratigraphy, which you may wish to view alongside the biostratigraphic data.
Versions
All interpreted data is stored within a version. The version selector on this tab controls the version in all views of the current well - including comments on the Occurrences tab, and charts in the Charts tab. Next to the version selector you can add Notes about the use of schemes within the current well/version.
Versions are database-wide (not defined separately for each well). If you only use one version (as is the case for many users), it is automatically selected and loaded. If you have multiple versions for the selected well, you must select one using the version menu on this tab before you can view interpreted data anywhere else in the Samples module.
The drop-down menu will only show the default version and any other versions in which data for this well have been recorded. To view (and/or select) another version which exists in your database, or to add a new version, click the ellipsis (...) to open the version selector dialog, where you can see which versions are available in your database as well as add or edit version names.
Creating and editing interpreted data
 The interpretations tab contains a number of tabs which represent different interpreted data types. Some data are represented as Interval data, where each item is bounded by a top and base sample (chronostratigraphy and biozones are of this type). Other data are recorded at a single sample (e.g. comments, sequence picks and events).
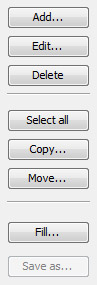
On every tab you can Add, Edit and Delete items using the buttons on the left-hand control bar. See How to Record Interpretations for more information about adding interpreted data.
Shortcuts: double-click a row to edit it. Highlight row(s) and press DEL on your keyboard to delete. CTRL + A is a shortcut for select all.
On most tabs you can also Move data to a different version. Select the intervals you wish to move and press Move, and you will be prompted to select the destination version. You can also Copy data in the same way.
The Fill button on interval data types opens the Fill Hierarchy dialog to fill to automatically create higher level intervals. You must select the intervals you want to fill above before you press the button.
On some tabs, the Save as button may be used to export a CSV file of the data. To pull the data out of any table, you can select the desired rows, press CTRL + C to copy to the clipboard, and then paste into another program (e.g. Excel spreadsheet). In this way you can create and modify CSV files of the table data.
Column Mapping
For each of the biozones, lithostratigraphy and chronostratigraphy data types, you should define a column map. select the appropriate tab and press Column Mapping... to open the Column Mapping dialog (see the dialog page for more information about column maps).
Depth/Age Curve
The Depth/Age Curve tab is unlike other tabs. See the Composite Standards and Depth/Age Curves page for more information on using this feature. Although the depth/age curve can be created node-by-node on this tab, it is more useful to use a depth/age chart panel to create and refine the curve, then adjust small details here. In the table, you can edit the Age and Depth by double-clicking in the table columns.
Note: The depth/age tab has a button to "Create Samples...". This is to auto-generate a LOG type sample at each of the unconformities defined in the depth/age curve. Generating these samples will allow you to pick the exact depth of the unconformity when picking stratigraphic interval boundaries or sequence picks. We recommend in particular that you pick sequence boundaries using these LOG samples, because on chronostratigraphic (Wheeler) diagrams it will split any correlation lines across the age interval. If the boundary or pick depths are not picked on LOG samples, or the sample depth does not exactly match the depth/age curve unconformity depth, then the correlation lines will plot either above or below the age gap, but not span the gap.
More help...
For more help on each data type, Add or Edit an interval and press the Help button on the resulting dialog.
Page last updated: 05-Dec-2014 9:47