| << Previous | Learning Trail | Contents | Section 6: Interpretations | Next >> |
| StrataBugs Learning Trail | Section 6: Interpretations |
How to record interpretations
Geological interpretations include Biozones, Chronostratigraphy, Lithostratigraphy, Sequence Picks, Palaeoenvironments, Events, Lines of Correlation, Biostratigraphic Comments and Interval Comments. Interpretations generally consist of one (point) or two (bounding) samples and a link to a unit, surface or event in a scheme. Therefore, to record interpretations you should first define schemes and their component units.
A common type of interpretation is the 'interval' - chronostrat, lithostrat and biozones. All intervals MUST be linked to a scheme (e.g. 'Gradstein et al 2008'). They should also be linked to a unit from the scheme (e.g. 'Tortonian'). If an interval is not linked to a unit, it must be given an informal name instead.
You can make interpretations in the Samples & Interpretations module or in the Schemes & Interpretations module.
Samples & Interpretations
- Open the well in the Samples & Interpretations module. If you have opened more than one well make sure that you have selected the correct well name tab before adding any interpretations. Select the Interpretations tab.
- From this main tab select the appropriate tab for the type of interpretation you want to record.
- Select a Version for the data from the drop down list.
- Press Add... to open the Interval dialog (or another appropriate dialog for non-interval interpretation types like comments), where you can define the bounding sample(s) and link to scheme units.
Note: If you enter intervals linked to units from low in a hierachy (eg. as 'age' in a chronostratigraphic scheme) you can choose to automatically create intervals using the scheme's higher levels (eg. epochs). Use the Fill buttons on the chrono-, litho- and biozones tabs.
- You can edit the interval later either by pressing Edit... or double-clicking on the interval in the table.
Quick method - adding intervals
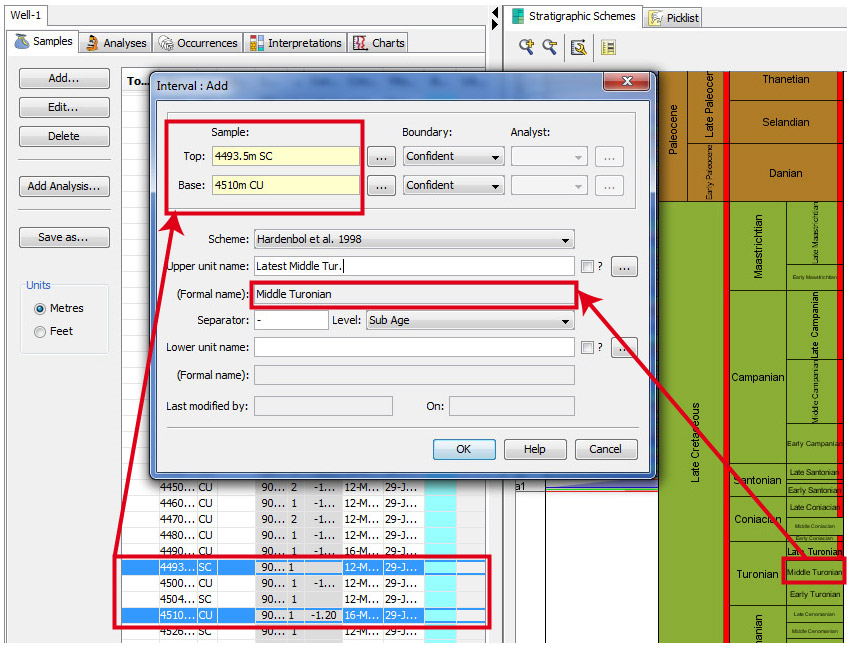
The Interpretations tab (left) interacts with the Stratigraphic Schemes tab (right) so that you can add interpretations to wells directly from the scheme chart. Units which appear in the selected well/version are highlighted in red on the scheme chart. This method is extremely quick, particularly if you do not have Lower unit names to enter.
- Select the samples tab in the lefthand pane and highlight the sample which will form the top or bottom of the interval you want to add. Once the sample is highlighted, you can navigate to another tab (eg. the Interpretations tab) if you wish.
- Open a suitable scheme chart in the Schemes tab by pressing
 . You can also add a scheme by pressing "Show Scheme" the Interpretations tab.
 - In the scheme chart, double click the unit you wish to enter. This will open the Interval dialog and pre-populate the Top and Base sample fields with the sample(s) you selected, and Formal upper unit name field. You can qualify the upper unit name if you wish. You can also change the Top and Base sample depths for the interval, adding them first if necessary. If required you can change the upper and lower boundary types and add a Lower unit name.
Hint: you can highlight two samples by holding the CTRL key; they will will appear as the top and base of the interval.
You can also use this method to add events: open a composite standard in the schemes pane, select a sample and double click the event to add it to your well interpretation. Likewise, to add sequence picks, open a sequence scheme and double click on a surface (hint - when you are close enough to the surface its name will appear in a tooltip).
Quick method - editing interval boundaries
 You can can edit the boundaries of an interval plotted in any chart in the Charts tab of Samples & Interpretations.
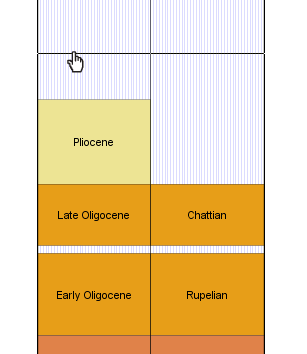
When you hover your cursor over the interval boundary you will see the cursor change to a hand icon. This indicates that you can 'drag' the boundary to another sample.
You can only drop the boundary at a sample (because intervals are bounded by samples). When you are dragging the boundary, a line appears when you are above a sample. The sample depth and label appears in the info bar at the bottom-left of the screen. If you want to change the interval boundary to a sample which does not yet exist, you can right-click at the position you want to add it and select Add sample at current position from the pop-up menu, which opens the Sample dialog.
In the Schemes & Interpretations module
In the Schemes & Interpretations module you can view and edit interpretations for groups of wells and projects. Click here for the tutorial on editing interpretations in this module.
Page last updated: 05-Dec-2014 9:50