| << Previous | Learning Trail | Contents | Section 5: Schemes | Next >> |
| StrataBugs Learning Trail | Section 5: Schemes |
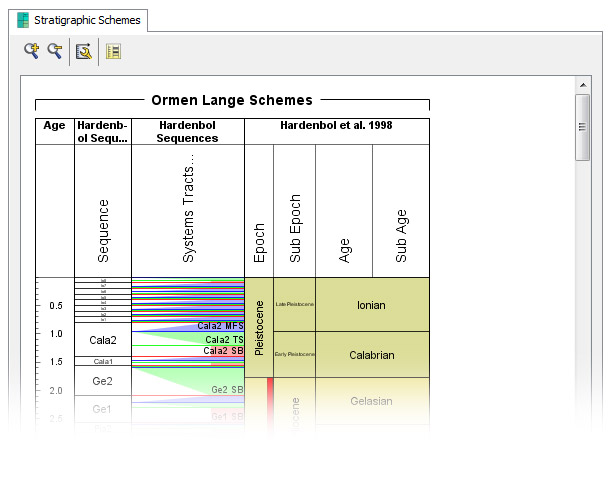
Stratigraphic Schemes tab
The Stratigraphic Schemes tab displays a scheme block in the right-hand pane of the Samples & Interpretations module. It is intended to be both a visual aid and an interactive feature to be used in conjunction with the Interpretations tab. The block's well and version are set to the current well/version selection; units which have been picked are highlighted on the plot.
Displaying schemes
Press the select scheme icon ![]() and search for a scheme block template. You can change age range and scale using the Chart Properties dialog (
and search for a scheme block template. You can change age range and scale using the Chart Properties dialog (![]() ), as well as the other chart properties. Your selection is saved for your next session. To edit the scheme block or change the panel properties, you must use the Charts module.
), as well as the other chart properties. Your selection is saved for your next session. To edit the scheme block or change the panel properties, you must use the Charts module.
You can also add schemes to the plot using the "Show Scheme" buttons in the Interpretations tab. These panels will be placed in a separate block and will not be saved for the next session.
Making interpretations
If a version is loaded on the Interpretations tab, units of the scheme which have been used in interpreted intervals are highlighted in red. You record a new interval by double-clicking a unit in the scheme (selecting the appropriate sample(s) in the Samples tab beforehand makes the process even quicker). You can also add well events in this way, by displaying a composite standard in the schemes tab and double-clicking on the standard's events. This process is described in more detail on the How to Record Interpretations page.
Page last updated: 05-Dec-2014 9:42