Chart Annotations
Annotations are blocks of free text which are anchored to a position on the chart. Using annotations you can add visual comments which do not form part of the StrataBugs data, and which are preserved if you subsequently update the chart layout.
Annotations are a useful tool for describing or drawing attention to particular areas of the data which you might otherwise have to achieve by marking up a PDF chart in another application.
Health warning: chart annotations should not be used to replace comments which are a legimiate part of the StrataBugs data - including biostratigraphic comments, interval comments, analysis comments and many others. These data points are audited, searchable, exportable, and in some cases linked to an interpretation version. Chart annotations have none of these features.
How to add annotations to a chart
- Right-click where you want to the annotation to be anchored and choose Add annotation here. Type in the annotation text and press OK. The annotation is added to the chart and is selected (has a dotted outline).
- With the annotation selected you can move it and resize it by dragging the mouse. You can add a pointer using the pointer button or delete the annoation using the delete button.
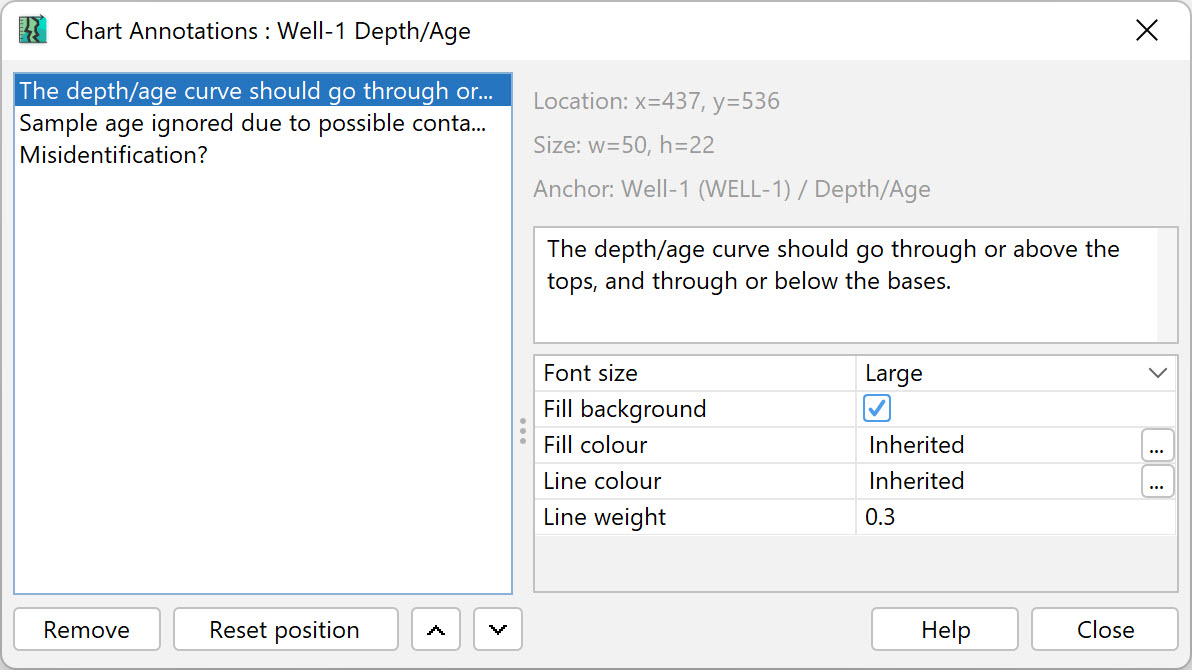
- Properties such as fill colour and text size can be edited using the properties table. The font face is linked to the chart's font (you can set this on the chart properties dialog).
- Double-click on the annotation to edit the text.
Anchor point
The top edge and the arrow pointer are anchored to the vertical scale of the containing block. If you change the block's scale or scale limits, the annotations will still 'point' to the same data. If you move the block, the annotations will also move.
If the arrow pointer (or the top-left corner of the box, if it doesn't have an arrow) is not within a block then the annotation is not anchored. It will stay in the same position regardless of other changes in the chart.
Annotations are NOT achored to a panel, or horizontal position within the block. If you rearrange the panels, or their width changes (which may also happen if the data are updated), the annotations may no longer 'point' to the same data.
In map blocks, the anchor point is linked to the geographical location on the map, so if you zoom or pan the map the annotation will stay in place (although it will not be resized). If you move the map such that the annotation moves outside its area, it may no longer be anchored in the block.
Styles and order
You can control the appearance of annotations to suit their purpose. Use the properties table when the annotation is selected.
By default the line and fill colours are inherited from the chart's foreground and background colours. You can also use a 'no fill, no text' annotation to act as a highlight box - but beware the limitations on anchor point discussed above.
Annotations are drawn in the order, so those later in the order will be drawn over the top of the first ones if they overlap. You can change the order by right-clicking on an annotation and choosing Bring to front or Send to back. You can also use the annotations dialog (see below).
Annotations dialog
From the main menu bar choose Chart / Template > Show annotations... to see a list of annotations in the current chart. You can use this dialog to change their text, properties and order. You can also reset the position of annotations which have moved outside the chart area.
Page last updated: 19-Oct-2022