How to create and use Map blocks in StrataBugs 3.0
You can now incorporate maps into StrataBugs charts. If you are familiar with the concepts in StrataBugs 2.1 of chart blocks and panel templates, then the components of map construction will seem a natural extension of this.
Map Blocks
Map blocks are similar to the Well, Scheme and Project block types; instead of panels, they contain layers. The map block template can be placed on a chart in a similar way to other block types. The instance of the block on the chart then defines the geographical extent and scale of the map, and the stratigraphic range which applies to the well data displayed. Just as with well blocks, you can have multiple instances of a map block template in one chart.
Map Layers
Map blocks can have one or more data layers. The data layers form an ordered set, similar to the way a well block has an ordered list of panels. The layers are of 3 basic types: Well markers, Shapes, and Data. The layers have properties which you can set in a similar way to panel properties, and are stored in their own template to enable them to be shared by other map blocks.
-
The Well Marker Layer is responsible for the well labels. If there are no data layers, this layer provides a simple point graphic to show well locations.
Shape layers use externally generated data from shapefiles or external mapping services (WFS). Currently the rendering of these shapes is restricted to simple lines and points. This is enough to show a country outline, points, or block boundaries. Shapefiles can be imported directly into the StrataBugs database.
- There are several types of data layer which show some attributes of StrataBugs well data. These are expressed as concentric pie charts. The data range is defined in the map block properties, as either an age range or a lithostratigraphic unit.
Creating your first map
Unlike the other block types, you cannot edit a map block template outside an existing named chart (i.e. you can't open it on its own template tab). For v3.0 the 'template edit mode' is introduced instead.
Create a new named chart in your project. You will now be able to see the block templates palette.
-
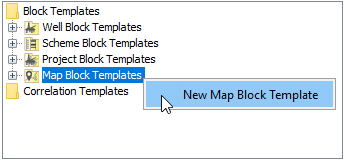
Create a new map block template (right-click on the Map Block Templates folder in the palette). When prompted, add the block to the chart (later you can do this by dragging and dropping onto the chart, as for other types of block templates).
Your chart now has a map block, but because the block template has no layers, there is nothing drawn on the block.
-
Right-click on the map block and select Edit block template. Your chart tab is now in 'template edit mode', and you are editing the template of the selected block. The palette allows you to select map layer types. Clicking on a layer template shows its properties in the properties pane.
Select a layer template and drag it onto the chart. The layer is added to your map block template. The middle pane now shows a list of the block template's layers, with the new layer selected. The layer's properties are shown in the properties pane.
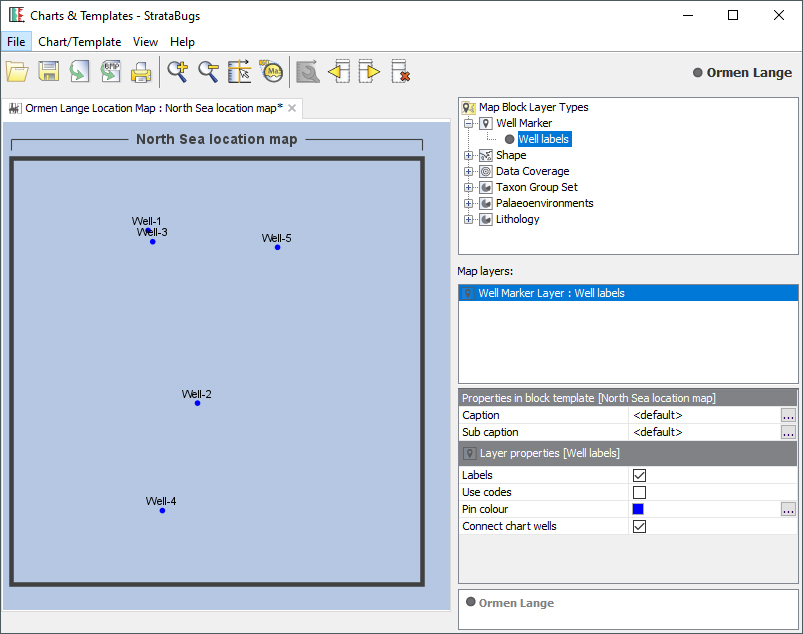
Note: the layer's caption is used for the map legend.
-
To save the block template and exit the template edit mode, either use the 'save' button on the toolbar or click on any area of the chart outside the map block. The tab colours revert back to normal. Click on the map block to select it and edit its properties in the properties table.
- Drag the edges or corners to resize the block (which also changes the geographical extent of the map);
- Click and drag the map to 'move' the contents;
- 'Zoom' the map by holding CTRL and pressing the + or - keys on your keyboard.
- 'Zoom' the map by holding CTRL and using the mouse wheel.
- Use ALT and drag a region on the map to zoom the map block to that region.
With the block selected, you can also use the following to adjust the block size and map bounds:
Shapefiles
There are some useful shapefiles for general geographical features available through the Natural Earth website: here
For hydrocarbon activity on the Norwegian continental shelf, shapefiles are obtainable from the NPD factmap pages, here
For UKCS open data use the North Sea Transition Authority Open Data downloads here
For USA Gulf of Mexico BSEE, licenses, lease blocks, wells, pipelines etc. here