Age Curves
The v2 database supports storage of age curves. These curves are much like wireline log curves, but use ages in Ma instead of depths. The curves could be used to store scheme-type data such as sea level or isotope curves. You can plot curves in the Stratigraphic Schemes tab in Samples & Interpretations.
Reading curves
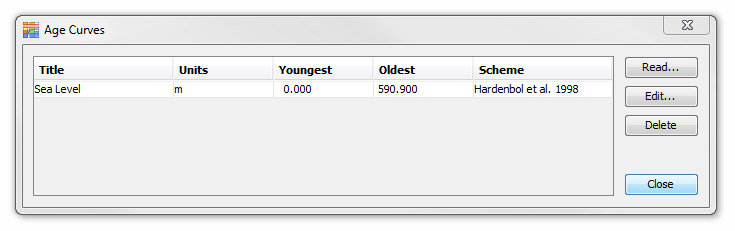
In the Schemes & Interpretations module, select Age Curves from the Schemes menu. The Age Curve dialog shows:
To read in a file, press Read... Files should be in .CSV (comma delimited) format (with the first column having the age values) or within a Timscale Creator data pack (.txt). Contact us if you need to use files of a different type. On selecting the file you will see a variant of the dialog below.
Complete the Age Curve Reader dialog:
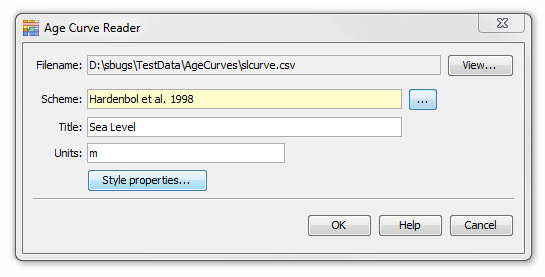
Press View... to look at the contents of the file in a separate dialog.Your age curve must be linked to a chronostratigraphic timescale. Press the ellipsis (...) to view and choose from available schemes.
The curve must also have a title (up to 80 characters) and units (text up to 25 characters).
Set the style properties if you wish. If you do not set them, defaults will be used.
When you press OK your curve should be read into the database. If you encounter errors here (or nothing appears to happen), check that your file is formatted correctly and try the process again. If problems persist, please contact StrataData for help.
Editing Curves
You can delete a curve by selecting it in the table and pressing Delete.
You can edit the values and attributes of a curve using the Edit Age Curve dialog, by selecting a curve in the table and pressing Edit, or double-clicking on a curve.
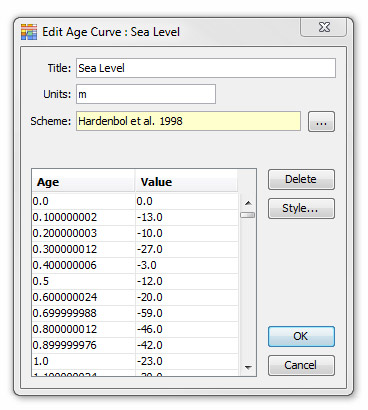
You can edit the title, units, scheme and style of the curve.
Individual rows of data can also be deleted (but not edited).
Plotting Curves
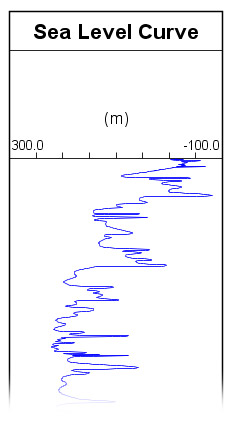
You can create a panel template to display your age curve, which can be added to scheme blocks.
Page last updated: 07-Aug-2014 10:41