How to set up dipmeter logs
Dipmeter logs are plotted with a "Tadpole" symbol with the bedding plane inclination given by the left/right position of the symbol, and the "tail" pointing to the direction, or azimuth, of dip.
To use StrataBugs for dipmeter plots you should first be familiar with the process of importing and using wireline logs.
The dipmeter log differs from other wireline logs because it is a combination of 2 curves: the dip angle and the azimuth. The procedure is to import the pair of curves and set up a panel template which uses the tadpole symbol and provides the n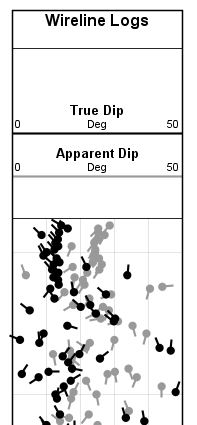 ame of the dependent curve. You can combine multiple tadpole symbols in the same panel but with the following restriction: the symbol will be plotted in the reverse alphabetical order of the log abbreviation, meaning that the curves that are highest in the ordering will overplot the curves lower down. If you want to therefore combine a true dip with an apparent dip, and the apparent dip plotted underneath the true dip curve, then the abbreviation for the apparent dip must be alphabetically lower than the true dip curve abbreviation. The following steps assume you are adding new log definitions for both true and apparent dip curves. You will only need to do this once in your database. Once you have also set up a custom chart template you will not need to change this: for subsequent wells you just need to import the curve pairs, and plot the custom panel template.
-
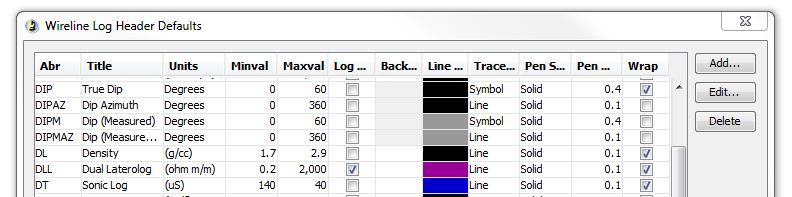
First you will to ensure that you have a copy of StrataBugs that is built on or after 23 Oct 2015. (You can use Help | About in the Control Panel to verify this). Set up the dipmeter curve header defaults. From the control panel, select Config | Wireline log header defaults ... and Add a pair of defaults for each curve. We would suggest using the following curve abbreviations: DIP = True dip, DIPAZ = Azimuth of true dip, DIPM = measured, or apparent dip, DIPMA = Azimuth of measured dip.
-
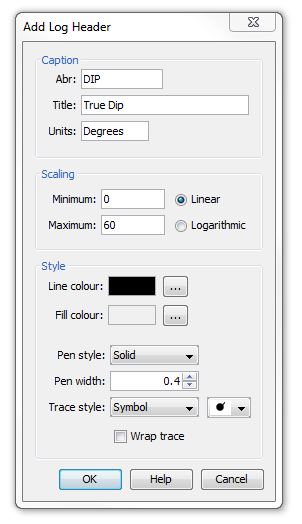
For the DIP and DIPM curves, set the properties as shown below, but each with different colours. Make sure you increase the Pen width from the default value as this width is used for the tadpole "tail". Use a width of 0.4. The Line colour will be used for the tadpole symbol colour.
- You will need to add a default header for the azimuth curve and for the measured dip azimuth curve. For the azimuth logs you do not need to specify the line attributes or symbol types, as they will not be shown. For the measured/apparent dip, it is a good idea to set the colour to grey.
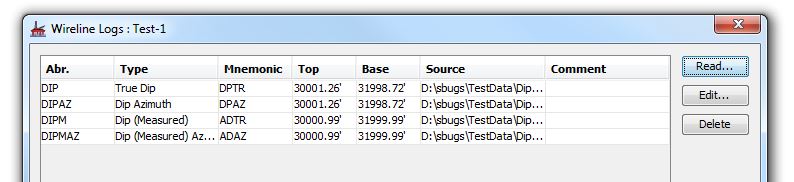
- Import the curve pairs into your well using the Wirelines ... button in the Wells module. For true and measured dip you will need to import four curves.
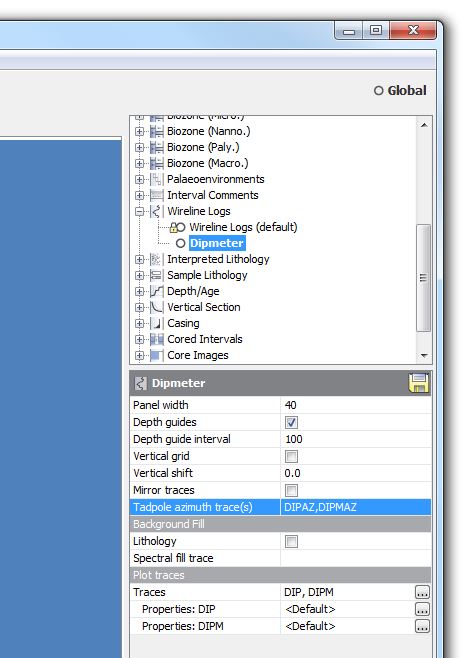
- In the Charts and Templates module, create a new Wireline Log panel template. Select the two DIP traces as the plotted traces. In the panel properties, add the abbreviation of the azimuth curve(s) into the Tadpole azimuth field. Save the panel template and add to a well block for display.
Page last updated: 23-Oct-2015 12:14