| << Previous | Learning Trail | Contents | Section 2: Wells | Next >> |
| StrataBugs Learning Trail | Section 2: Wells |

How to set up wireline logs
A 'wireline log' is a list of depth/value pairs which are plotted as a curve on charts. Usually these data are generated using the drilling tools and provided as .LAS or .TXT files. You could also use the wireline log features to store and display any other depth/value curves, e.g. geochemical data such as isotope ratios.
You can store wireline log data from files within your StrataBugs database. Files of type .LAS, .TXT and .CSV can be imported. Wireline logs are used in chart displays which are documented elsewhere.
- First open the well in the Wells & Outcrops module. Press Wirelines... to open the Wireline Logs dialog:
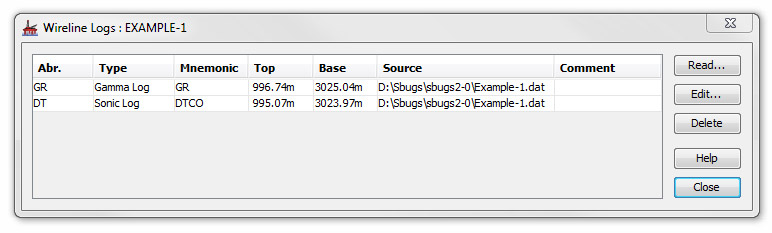
There is no limit to the number of logs you can store. You may have several logs of one type. Usually these are plotted together on charts, so it is not recommended that logs of the same type have overlapping depth ranges.
To view a table of the values in a stored log, and the log's comment, press Edit. The dialog also allows you to delete rows from the log trace, and edit the comment.
Press Read... to open a standard file selector and open your log file.
-
Your file will appear in the Wireline Log Curve Reader dialog.
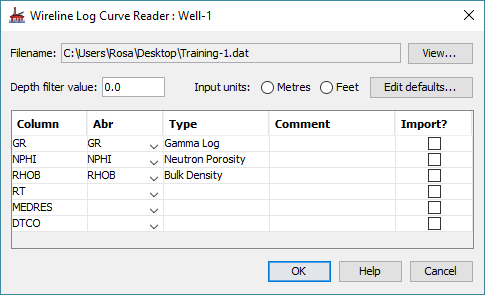
The filename and path will be displayed in the Filename field. You can view the layout of the file in a file viewer by pressing the View... button to the right of this field.
The Column field contains a drop-down list of log curves in the selected file. Select one of the curves and the default log Type will appear as an abbreviation and as a full title.
Entering a depth filter value will speed up the importing process by reducing the number of data points read, and keep the amount of data stored to a sensible level. The reader will read only one value per depth interval set in this box. For example, if you enter a value of 1.0, the reader will record a maximum of one value per metre or foot (depending on the units you select).
Note: null values (recorded in files with a value of -999 or -999.25) are skipped by the reader.
You must select depth units for input.
Press OK to select this curve for importing into your database. Repeat this process for all the curves you want to associate with the selected well. These may be curves from a single file or from different files.
-
To edit the default attributes of any curve type press the Edit defaults button. This will open the Wireline Log Header Defaults dialog. You can also open this dialog from the StrataBugs Control Panel by pressing Config | Wireline Log Header Details...
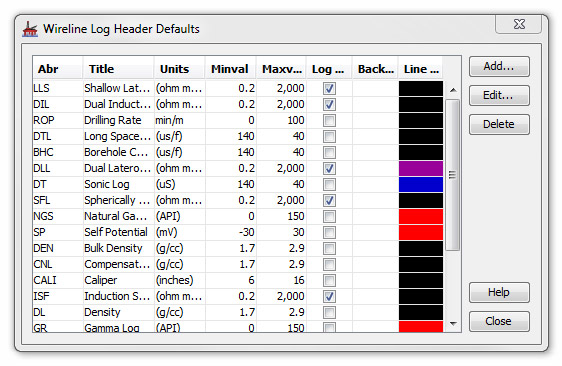
To edit any of the text associated with any particular log curve double click on the appropriate row (or press Edit) to open the Edit Log Header dialog. You may also Add new headers.
Wireline Logs Panel
The wireline logs panel type can be used in well blocks.
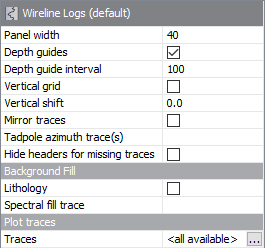 |
Depth guides are horizontal lines drawn at regular depths; the value entered will be taken in the block's units, which might change with context. This is also true for the depth shift which adjusts the depth values of trace data points. You may set a Vertical grid which is based on one of the traces you are displaying. This is of particular use if you are displaying both logarithmic and linear traces. If this option is checked, a row appears below in which you can type a value for the desired trace.
|
Your panel template can either choose to plot all log traces which are available, or you can specify specific traces to plot (click the button in the traces row to choose from available log types - select none of them to plot "all available").
All traces are plotted using the default log header settings for the trace type, unless you specify custom settings for a particular trace (as in the above example - not that you can't do this with the "all available" option). You can edit the defaults from the Control Panel Config Menu.
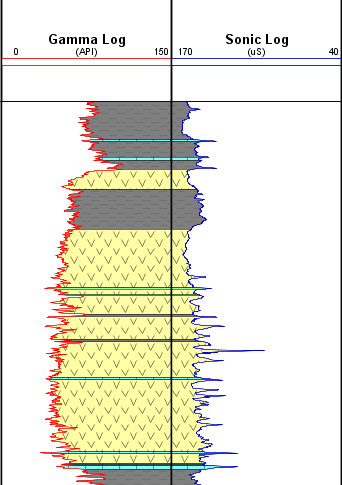 |
Check the Lithology checkbox to plot the well's interval lithology as a background to the wireline logs panel. This image shows two separate log panels, each displaying one log. The gamma log's trace style is 'fill left', with a while fill colour and red line. The sonic log's trace style is 'fill right', again with a while fill and a blue line. Both panels show the background lithology. You could also do this within one panel - though you might wish to adjust the scales of the individual traces.
|
Page last updated: 10-May-2024