StrataBugs is the biostratigraphic data management system of choice for biostratigraphers worldwide. It protects data integrity and minimises data entry tasks so that more time can be spent on interpretation.
The current data model release is v3.0.
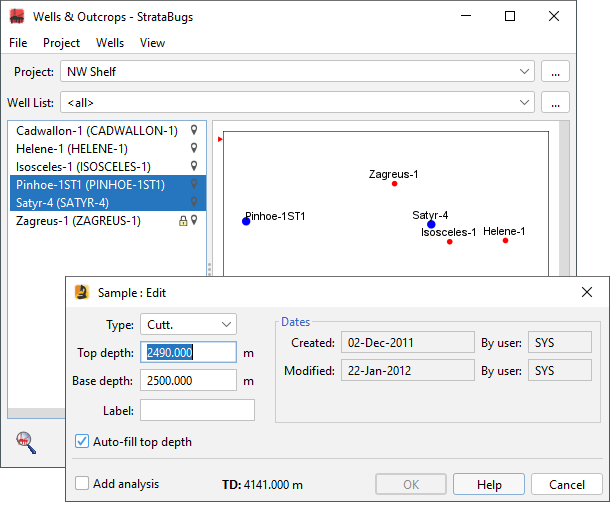
Wells and Samples
Boreholes, sidetracks and outcrops with their own sample lists.
Well header storage is comprehensive - including alternative name, operator and license details, location, and depth datums, with the option to view live headers from another database. Outcrop data can be entered easily and consistently, measured above or below a reference datum.
Wells can be organised into projects and well lists. Wells can be marked as 'restricted', hiding their data from non-privileged users.
Samples are recorded by depth/elevation (in feet or metres), and type (cuttings, sidewall cores, cores, outcrop). A single sample list is linked to all other well data. Core shift data can be stored and used to correct sample depths by type. A deviation survey can be used to translate depths to TVD.
From v3.0, well locations can be visualised on maps.
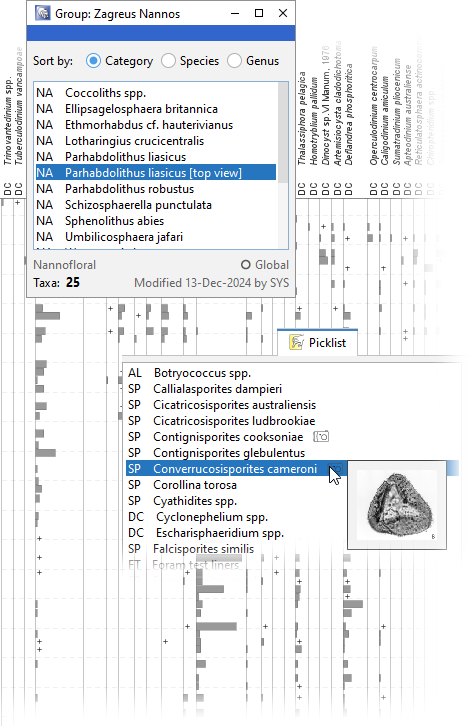
Fossil Counts
Species count data is the basis of biostratigraphy. In StrataBugs, species occurrences in wells and outcrops are backed by a fully featured taxonomic dictionary.
Curate your own taxonomic database; add images, link synonyms, merge, group and edit taxa. Add or import your own species, or bring them in from online dictionaries.
Choose an occurrence entry method which suits your workflow: use a picklist, external device, numerical codes or import from files. The data structure fully captures the nuances of your count data, including situation types, questionable identity, markers, sub-types. Store specimen images with well data which are accessible from the taxon dictionary.
Explore your count data using the sophisticated biostratigraphy chart panels. Features include absolute or relative abundance (various calculations), histograms or saw-tooth curves, multi-trace group total display and stacked curves, species richness and diversity calculations, presence/absence, constrained and unconstrained clustering.
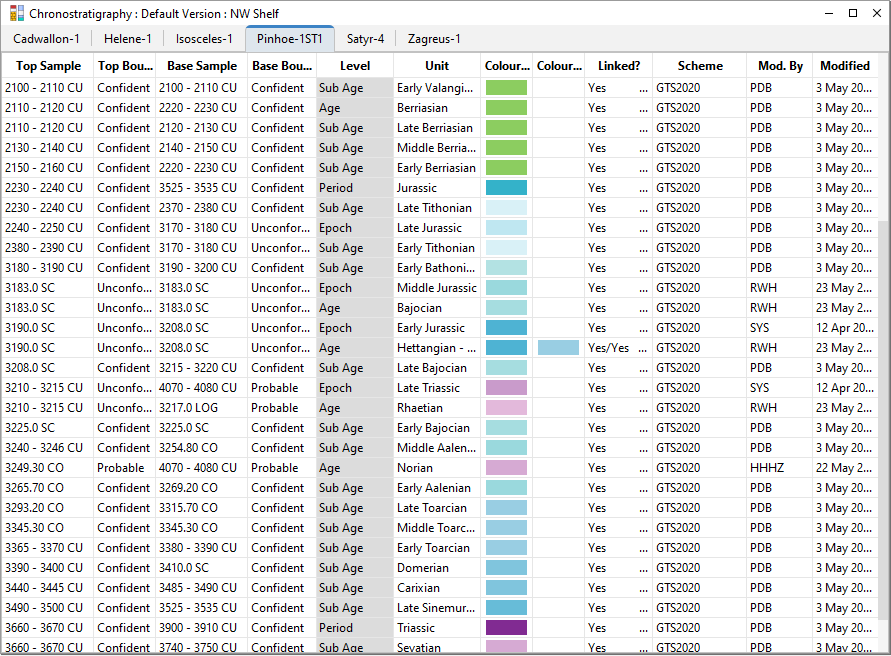
Interpretations
Interpret fossil data as intervals and picks, to integrate with a wider geological model.
Data types include biozones, lithostratigraphy, chronostratigraphy, sequences, palaeoenvironments. Interval boundaries are linked back to samples, and can be recorded with different degrees of confidence or as unconformities or faults. Gaps between sampled intervals are clearly displayed on plots. Different 'versions' of interpretations can be stored and compared.
Schemes with unit ages underpin the interpreted interval data. This allows for consistency in recording, inferences about age, comparison between wells, and correlation. Schemes can be plotted for reference.
Graphic Correlation
Interactively create an interpreted age model, using picked or generated events and a composite standard.
Biostratigraphic events (user-defined or generated automatically from the occurrence data) can be cross-plotted with a standard event scheme. Manipulate the depth/age line via drag-and-drop nodes, with all the contextual data to hand. Highlight unconformities and breaks, and assign confidence ranges to sections. The resulting age model can be used to generate other interpretations, or to visualise sections on an age scale.
The event data model, which underpins these features, links back to the taxonomic database. In event schemes, dictionary events are assigned ages. Event schemes can be plotted as stratigraphic range diagrams, including taxon images. In wells, the dictionary events are linked to samples (depths), and can be correlated between sections.
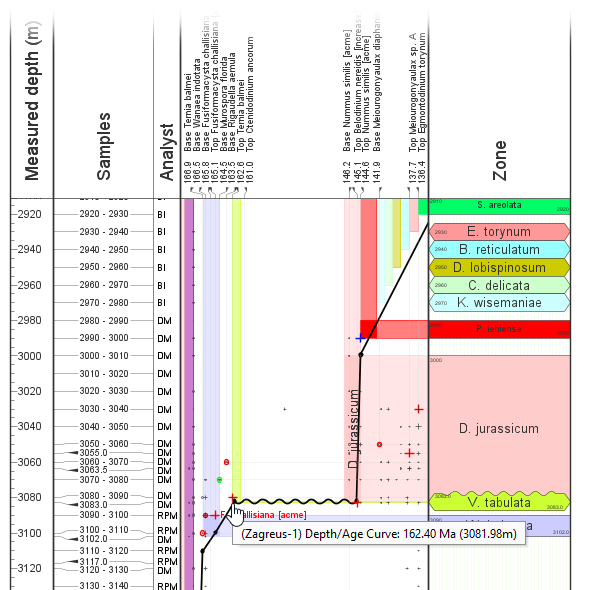
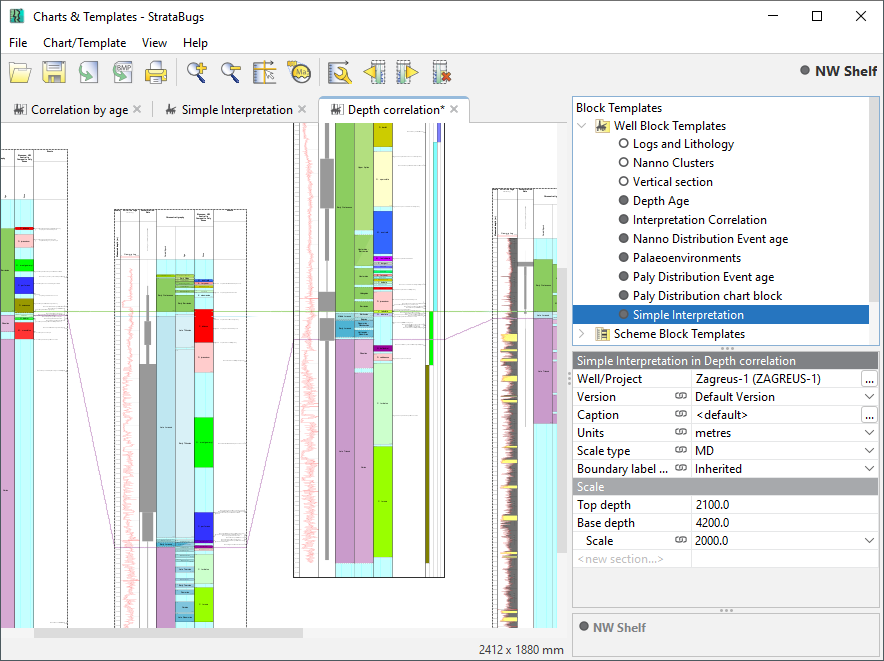
Chart and Correlate
Capture detail in multi-well correlation plots, or create concise plates for publication.
Charts are integrated into every part of StrataBugs. The template system lets you re-use components across multiple charts and wells. Apply a preconfigured layout to any well or wells, then modify it later. Design your own templates-as-tools and use them as part of your interpretation workflow to interact directly with the data.
Explore spatial trends in the biostrat data using maps, which are integrated with traditional chart blocks.
Export charts as PDF or SVG documents, bitmaps, or exchange as data files.
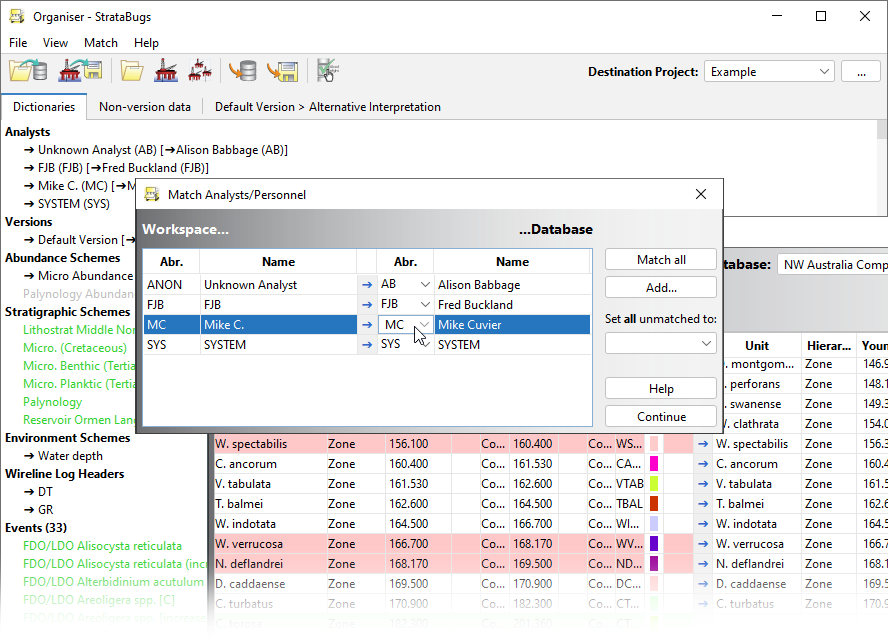
Organise and Exchange
Exchange data with other StrataBugs users, in StrataBugs and other formats. The powerful import tool allows you to inspect incoming data before commiting it to your database, or crop outgoing data before sending.
Organiser recognises and highlights data conflicts between the incoming data and your StrataBugs database. Conflicting data, from individual items to entire datasets, can be edited or excluded. You can choose to switch between incoming dictionaries and your local standards.
StrataBugs has its own (human-readable) .SBG file format, and can also import many current and historical file formats from other systems.