Updates and licensing
Many of you will be receiving a licence expiry notice when you start StrataBugs. This is because we try to align our renewals of Maintenance and Support payments to the calendar year end. If you need to refresh your licence, get in touch. This article explains our licensing policy.
What is a licence?
StrataBugs is licenced software rather than freeware, or open source. You need a valid licence file to run the application.
Why am I receiving this message when I previously bought a permanent licence?
We no longer issue permanent licences. This is to align with our policy of issuing new licences only on a subscription basis, and the removal of the hardware key (dongle) as a form of licensing. Since the release of version 3.0, all licences are “soft” licences and linked to a host machine. This might be an individual machine or a licence server which provide licenses to one or more simultaneous users. If you, or your organisation have previously purchased a permanent licence and have continued to support us through Maintenance and Support annual payaments, then you will be entitled to a renewed licence for your host machine(s) or server indefintely, and the licence will grant access to the latest versions and updates.
Older versions of StrataBugs that use the hardware key are being phased out, the last version that could use it was v2.1.1. We no longer support versions prior to v2.1, but will assist if you have a database from a previous version that needs conversion to the latest.
If you have previously bought a permanent licence and want to continue to use the software unsupported, you may do so, but are not entitled to any updates or troubleshooting help. In this case a new licence will be issued annually for your current machine, for the version that you have paid for, or the latest version applicable at the end of the last maintenance and support period.
If you have bought a subscription licence for a fixed period for longer than a year, a new licence will be issued annually. If the subscription period is a year or less, then if the subscription is not renewed you will no longer be able to run the application. Note that your database remains your property and as long as it’s not deleted, can be accessed from future subscriptions at any time (subject to future database upgrade requirements).
Can I change my StrataBugs computer?
If you change your StrataBugs computer we will issue a new licence for the new machine after you have advised us of the new hostid codes.
When you send the codes, copy and paste the text into an email, not a screenshot of the codes – this will ensure that the codes are not mistyped when we issue the licence file.
Windows ARM and a leg up?
What is Windows ARM?
Windows has recently become available for ARM based PCs in addition to Intel based PCs. The ARM processor is a smaller, so called RISC (Reduced Instruction Set) processor, that is now an option when purchasing a new PC. Some Microsoft Surface Pro machines have ARM, and anything with a Snapdragon X processor. This option has been available on Macs for some time, starting with the M1 family of processors. The new chips can be very fast, and have a lower power consumption than the Intel based equivalents, so it’s particularly useful for laptops for extended battery life.
You may be thinking of purchasing a new laptop following Microsoft’s discontinued support for Windows 10, so it is worth considering an ARM based one.
What’s the catch?
Most software that is currently built for Windows x64 will also run on ARM under compatibility mode, but this would not use the full potential of the processor, and equivalent apps can be slower under compatibility mode when compared to running natively. It is best, therefore, to run software that is compiled to run specifically on the ARM platform. If you install the StrataBugs windows bundle, you will find that the existing x64 launcher app in the ‘bundle’ (StrataBugs.exe) will not run, though if you download the x64 installer, you can run this on ARM.
StrataBugs on ARM
We’ve recently released 3.0.100, which is the 100’th update of the 3.0 application!
From StrataBugs 3.0.100, you have the option of installing for Windows ARM. Only use this installer option if you are running on ARM – you will not be able to install or run this version on an Intel based machine. If you install the x64 package on ARM, it will run in compatibility mode.
Either way, if you are using a local StrataBugs database, it’s fully compatible across platforms (even to MacOS).
Any drawbacks?
At the time of writing, it is not possible to obtain an ARM build for the SQL Server native client, which means only the thin client JDBC database driver is available. This means that if you are connecting to a SQL Server database on your local network which relies on “Windows authentication” for your access, it won’t work under ARM. This does not affect username/password connections, or connections to databases running in the Azure cloud.
Most devices will work fine under ARM, but not all devices are supported yet. We have a Canon printer and at the time of writing, it wasn’t possible to install a printer driver for it from Canon. Check your key peripherals first.
Contaminated data?
It’s been a while since the last blog post. We’ve been busy getting v3.0 out there and fixing anything that’s been cropping up, and many have now upgraded, or plan to upgrade in the near future.
One of the small but important changes in v3.0 was the addition of an occurrence type for “Transported” specimens, being those that are reworked environmentally but not stratigraphically. As well as this, we combined the “Caved” attribute into the same occurrence type, making them mutually exclusive, and thereby forming a hierarchy of “levels of displacement”, which begins with “In-situ” and ends with “Caved”, as illustrated on the new Picklist:
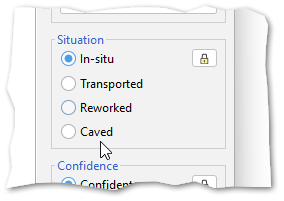
Since this introduction, we’ve had some feedback on whether we should also add a further level, of “Contaminated” occurrences. This would sit below Caved in the hierarchy. These can be specimens from modern contaminants, the lab, or drilling mud itself, none of which implicate caving of the borehole, but would be useful to be able to exclude from certain displays and operations.
We could add this new type as a further option in the v3.0 list. It would not require any changes to existing v3.0 databases, but an application update would be required for v3.0 (and v2.1) to be able to handle any data set which uses the new attribute.
Any comments on this proposal, positive or negative, would be welcome.
Webinar Session 7
The next webinar in the series will cover the taxon panel options and clustering. The first session will be on the 18th May at 10.00 BST, registration link here, and the repeat of this session will be on Tuesday 23rd at 16.30 BST, registration link here. Let us know of any topics you would like to focus on in the future.
Webinar dates for sessions 5 & 6
Session 5 repeat will be on Tuesday 9th May, link here. This session will cover map blocks and maps in charts.
Session 6 will cover correlation charts and depth/age panels and blocks, and will be on Thursday 11th May, link here, and repeated on Tuesday 16th May, registration link here.
Webinar dates for sessions 4 and 5
Thank you all for attending the webinar series so far. There will be a break next week, so the repeat of session 4 on a Tuesday will take place on the 2nd May 16.30 BST, registration link here. Session 4 will cover chart basics, how the templates work together, how to construct, use and edit templates to create charts.
Session 5 will extend the charts session and discuss maps, creating map blocks and layer templates. The first webinar of session 5 will be on Thursday 4th May at 10.00 BST, registration link here.
Webinar dates for sessions 2, 3 & 4
Contact me if you would like to access a recording or slides from the previous sessions.
Session 3 – Recording data – Taxa – Events – will be repeated on Tuesday 18th at 16:30 BST, registration link here.
Session 4 – Chart panels, layers, blocks and templates will be on Thursday 20th April at 10.0 BST, link here
There will be NO sessions in the week beginning the 24 April, we will resume the following week (w/c May 1st)
StrataBugs webinar dates
Thanks to everyone for attending the first session, good to get the ball rolling! Try to install v3.0 before next week’s session, where we will diving into the concepts and practicalities of recording some data. If you missed the first session, or want to recap, you can join the repeat on Tuesday, otherwise get in touch if you need help installing. In session 2 there should be more time for questions and you can try some of the practical tasks on your own database.
Dates and links for future StrataBugs webinars:
Session 1 repeat: 16.30 BST Tuesday 4th. Registration link:
Session 2 10.00 BST Thursday 6th April. Registration link:
StrataBugs training webinars
With the release of v3.0, we’d love all of our users to become power users, so we are starting a series of short webinars covering all aspects of the system. Over the course of several weeks, it will form a complete training course.
The sessions will be free to attend for all StrataBugs licence holders who have a subscription or support contract. You do not need to attend each session, and if there is sufficient demand, sessions will be repeated.
Each session will be for no more than 45 minutes, and cover a main topic. There will be a talk for around 20 minutes then a Q&A session, demonstrations, and future topic requests.
The first session will be on Thursday 30th March at 10.00am BST. There will be a minimum and maximum number of attendees, so register early to avoid disappointment. The topic in this session is “Installing and getting started”.
This is suitable for anyone who hasn’t installed StrataBugs, or has a previous version and not yet installed v3.0, or who needs to manage their own system. The overview of the setup and main components might also be suitable for IT staff who need to support StrataBugs in their organisation.
A introduction to the function of the main components will also be given, and an overview of how to get started with StrataBugs.
If you would like to attend but the date and time is unsuitable, then please let us know so we can schedule an alternative in the future.
Contact us through this blog or by emailing info@stratadata.co.uk, and we will send you a registration link.
StrataBugs examples in offshore wind turbine survey
It’s been a long time since the last StrataBlog post because we’ve been busy working on v3.0, which is out for pre-release testing.
In the mean time, we’d like to share with you links to some examples of StrataBugs being used in a shallow borehole study. Usually reports of this kind are proprietary and not available for general distribution. In this case the Netherlands Enterprise Agency have made available reports from BioChron which we are able to showcase the use of StrataBugs v2.1. In this report there are a series of embedded charts showing a multi-disciplinary approach using environmental grouping to resolve shallow stratigraphy relationships in combination with other age dating methods. These boreholes are drilled to determine subsurface conditions for suitability of wind farm pylon placement in the Southern North Sea.
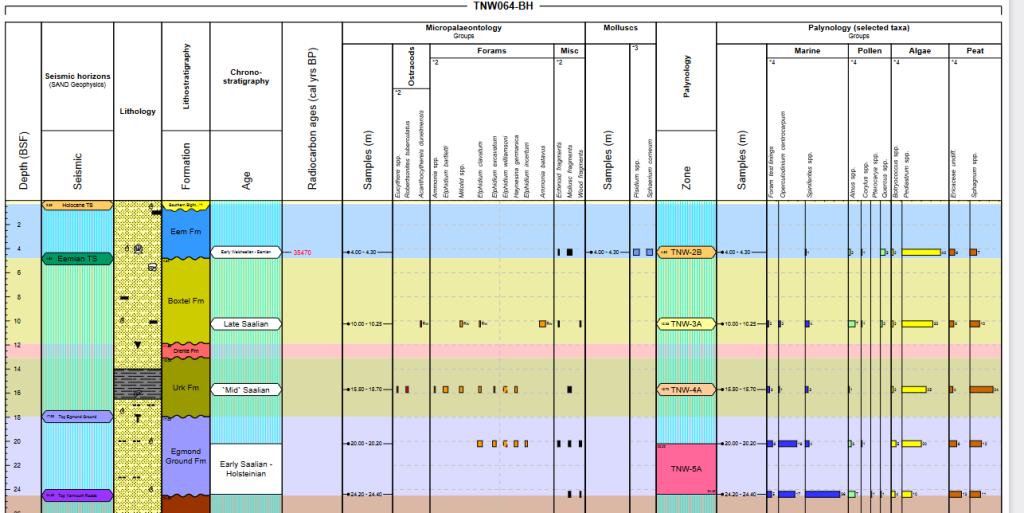
The reports are available from the links below. You will need to scroll down to the lower part of the reports to see the chart examples.
https://offshorewind.rvo.nl/files/view/976a1421-9ea2-4f42-9caa-1ea6c1eb82a1/tnw_20220210_gt_dating-analyses-geological-dating_fugro_f.pdf
https://offshorewind.rvo.nl/file/download/760792fb-0aef-4b85-b3de-c5d1d6f1140a/tnw_20220215_gt_dating-analyses-archaeological-assessment_fugro_f.pdf
Thank you to John Athersuch of BioChron Ltd. and the rest of his team, for sharing this with us. Further details are in the reports themselves.