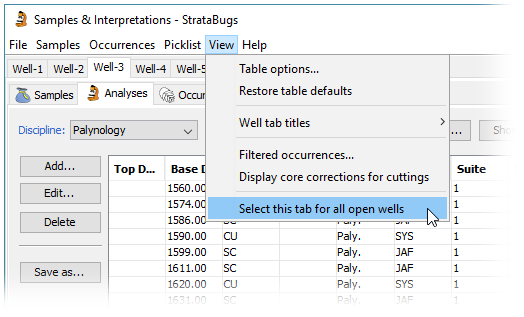
Select this view for all open wells
It is a common scenario to open up a project (containing many wells) in Samples & Interpretations, and want to look at the same thing in all of them. Perhaps it’s the micro analyses, the list of sequence picks in a particular version, or a particular templated chart. To save some tedious clicking we’ve added a menu option to replicate the currently selected view, as closely as possible, in all open well tabs.
Open up your project and navigate to the view you want to see in one well. Go to View > Select this tab for all open wells.
- The analysis suite filter (discipline, analyst, suite number) will be replicated for the Analyses tab.
- The version and interpreted data type tab selection will be replicated for the Interpretations tab.
- The selected chart tab will be replicated for the Charts tab, for wells which already have a tab for the same template (hint: you can use the menu option File > Open chart template tab for all wells… to initialise a chart template tab for every well in the project). The selected version is also replicated for the Charts tab.
New “spot cutting” sample type
The latest release of version 2.1.1 contains a new entry in the list of available sample types: the ‘spot’ or ‘bottoms-up’ cutting, SP.
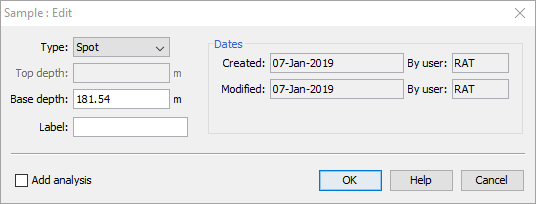
Spot cuttings are taken by pausing the downward drilling and waiting for the cuttings to arrive from the bottom of the hole. When drilling is restarted, the exact depth is known from the length of the drill string, giving a more precise depth.
The sample depth has the same precision as for a core sample since the cutting is taken from a known depth, but it is still a cutting sample.
When applying core shifts, Spot samples are shifted using the same settings for Core samples, not cuttings samples. So, if Core samples are shifted then Spot samples will be shifted. You can optionally decide whether to also shift Cuttings samples.
You can choose whether to display spot cuttings on charts. Existing samples panel templates will display SP samples in line with their setting for cuttings.
Note that in a multi-user environment, all users should update to the latest version before SP samples are added to the database, or any new samples will be seen as just cuttings.
Working with the Standard Chart
Amongst the many voices of approval from those that have got to grips with the templated charts in v2.1 there are always a few folks who are permanently wedded to the idea of “one well, one chart”, and don’t want to work in a templated view of the world. They also prefer a WYSIWIG panel property editor, so they can make individual panel changes as required for the well they’re working on. For them, getting to know the options available on the standard chart is where they need to start.
The Standard chart tab in the Samples & Interpretations module is always present, and contains a panel for all the data types that are present in the well. You can customise the standard chart by clicking in the chart properties icon in the toolbar: 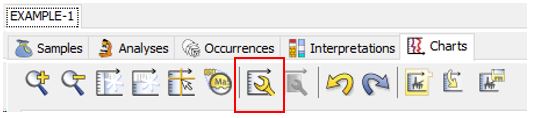 and using the panel list to add/edit and delete panels. Right clicking on any panel in the chart will bring up the option to edit the panel’s properties.
In this way you can create the chart you want. When you’re done, you can then use the rightmost button to save the chart as a template.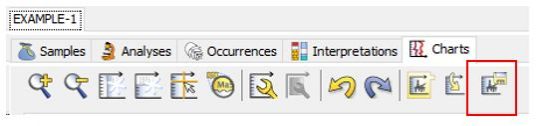
At this point you can name your template for use in the next well. Any panels that have different properties to the default will be saved in the new template.
In your second well, use the penultimate button on the toolbar to load the template you previously made into the standard chart…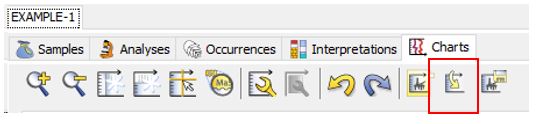
Now, make any changes you like to the panel properties. When you’re done, pres the last button again to save the template.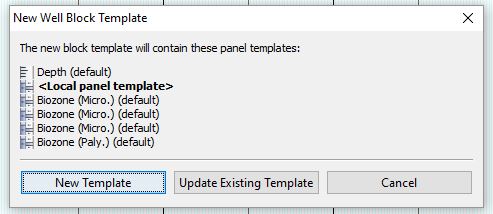 At this stage you have a choice: if you update the existing template, then this will also apply to your first well and any others that happen to be using this template. This may or may not be what you want. To keep things simple, you can select New Template, and the template name will be suffixed by the well name, and thereafter opened in a new tab bearing the template name.
When you next open your wells, the template tabs will reopen in the same state they were saved in, while the standard chart will reset to the default layout. To make changes, see above (load your template into the standard chart ….)
Lots more information on the charts tab, as always, in the help here.
Sample Depth Precision
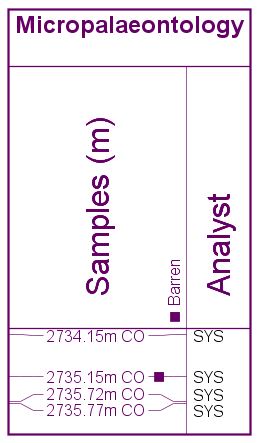
Possibly the most frequently asked question we are asked is “why do my samples show with different numbers of decimal places?”, or “where are the decimal places on my cuttings?”. StrataBugs charts have always displayed the different sample types with precision which reflects the nature of the sampling. Cuttings samples show to the nearest whole metre (or foot) because it would be misleading to suggest the depth was any more precise than that.
Here’s the full information for all sample types:
| CU | cutting | nearest whole metre or foot |
| SC | sidewall core | 1 decimal place |
| CO | core | 2 decimal places |
| OC | outcrop | 2 decimal places |
| LOG | log pick | 1, 2 or 3dp – configurable by super-user (Control Panel > Config > Default samples depths) |
This affects the charts and wherever samples are displayed along with their type and label in the data tables. The position of samples is still determined by the depth you give them (and which, in the case of cores (and optionally cuttings) may be affected by core shifting).
These levels of precision follow an industry convention used since version 1.0 of StrataBugs. One drawback is sometimes where you have a well originally drilled in feet and now dislayed in metres, where you would like to show the cuttings depths to 2 decimal places to reflect the converted number. You can do this in the Samples panel by checking off the “Display symbols” option in the panel propeties.
Within the database itself, all sample depths are stored in metres to at least three decimal places (dependent on the database type).
When is an analysis barren?
Analyses may be ‘prepared’ (yet to be analysed), ‘analysed’ (contains occurrences), or ‘barren‘ – indicating that they have been analysed but found to contain no taxa.
When we reviewed and tightened up all aspects of the way the biostrat data were stored in v2.0, it seemed sensible to enforce that analyses marked as barren did not contain occurrences of microfossils. Therefore the only option when clicking the barren flag was to clear all the occurrences. It’s been pointed out to us since that analyses can contain accessory minerals or perhaps caved taxa, while still technically being barren of microfossils.
The most recent test update will allow you to have your cake and eat it – you still get the option to clear the occurrence list, but you can have some analysed data while the analysis is marked as barren. This doesn’t require a change to the underlying data model, and any data files exported will reflect what you have on screen. The only caveat is that if somebody without the update imports the file, their analysis will not be barren.