Month: February 2016
Genera in Groups
A useful addition to StrataBugs 2.1 is the ability to include entire genera in groups. Previously if you wanted to do this, you would have had to find all the taxa from the genus (probably via a taxon search) and add them to the group. If you or a colleague added another species to the genus, you’d have to remember to add it to the group. The new system saves you this hassle and guarantees that the group stays up-to-date.
You should be familiar with the Taxon Database’s ‘Taxa’ window – this is your working list of taxa. Let me introduce you to its sister, the ‘Genus’ window. Open by choosing from the menu Taxa > Genera.
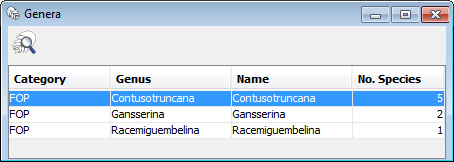
You can populate it with genera by hitting the search icon, or by dragging onto it species from any tables or lists in StrataBugs. Drag a genus from here onto the Taxa window to populate it with the member species. You can also drag the genera directly into your taxon groups. Go to the full post…
Charts Keyboard Shortcuts
Did we mention that the charts are interactive?! You’ll get a lot more out of them if you are familiar with these keyboard shortcuts.
Scrolling
- Use your mouse wheel to move up and down…
- … and hold down SHIFT with the mouse wheel to go left-right.
Zooming
- Hold down CTRL with the mouse wheel to zoom in and out.
- CTRL and +/- also zoom in and out.
- CTRL and 1 zooms to the normal scale.
- CTRL and 0 (zero) zooms out so that the whole chart fits on your screen.
Magnifying
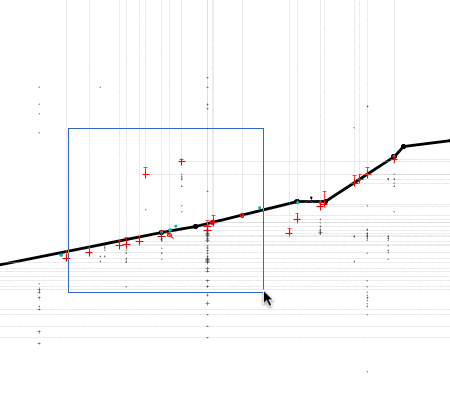
- Hold down ALT and draw a box to zoom to that area:
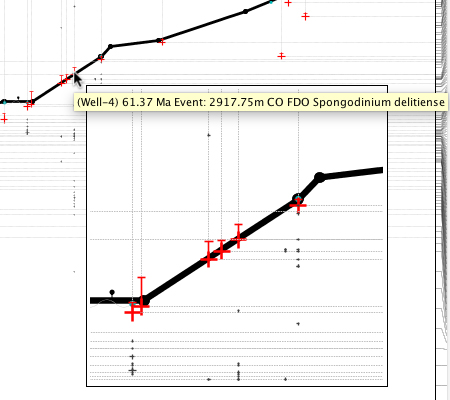
- Hold down the q key to toggle on the magnifer:
Undo and Redo
- Use CTRL+Z to undo or CTRL+SHIFT+Z to redo.

 Note – these are for undoing changes you have made to data via the chart – e.g. by dragging a node on the depth/age panel, or dragging an interval boundary. They won’t undo anything you have done via a dialog, including changing the chart properties!
General Relativity (‘Relative Inner’ vs ‘Relative Outer’ )
Expect the blog to feature many, many posts about the biostratigraphy panels. There are so many combinations of panel options that I shouldn’t think anybody is au fait with all of them – probably not even me! I want to start with something relatively (excuse the pun) simple. I’m also choosing this because it’s something that wasn’t possible before the new charts module was released.
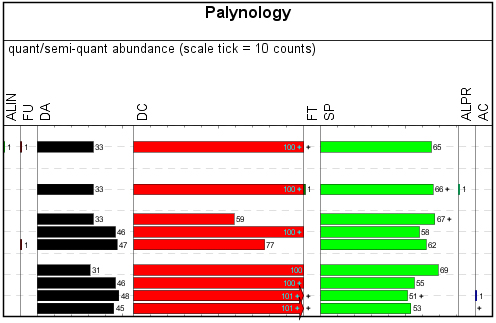
My examples use data from our demo dataset. My template starts out as a simple ‘group by category’ palynology panel – that is, I’ve kept all the basic options except changing “group data by” to “category”. In the real world this would be better as groups, for which you will also need to restrict the outer panel to a group set.
Everybody should be familiar with the “relative (inner)” calculation style – it’s been in StrataBugs since the year dot. It would transform a simple absolute-abundance style plot like this:
Into a relative-abundance plot like this:
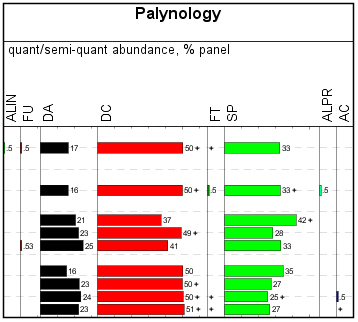
Each column shows its count relative to the total count for the analysis across the whole panel. Each row adds up to 100%. Well, OK, nearly 100% – since you asked, we’re rounding up to integer values except where we have less than 1%. Go to the full post…