Genera in Groups
A useful addition to StrataBugs 2.1 is the ability to include entire genera in groups. Previously if you wanted to do this, you would have had to find all the taxa from the genus (probably via a taxon search) and add them to the group. If you or a colleague added another species to the genus, you’d have to remember to add it to the group. The new system saves you this hassle and guarantees that the group stays up-to-date.
You should be familiar with the Taxon Database’s ‘Taxa’ window – this is your working list of taxa. Let me introduce you to its sister, the ‘Genus’ window. Open by choosing from the menu Taxa > Genera.
You can populate it with genera by hitting the search icon, or by dragging onto it species from any tables or lists in StrataBugs. Drag a genus from here onto the Taxa window to populate it with the member species. You can also drag the genera directly into your taxon groups.
Example with Workflow
Let’s look at this in the context of a real workflow. I will be making full use of the new charts here – so even if you know all about genus groups already, you might pick up a tip or two!
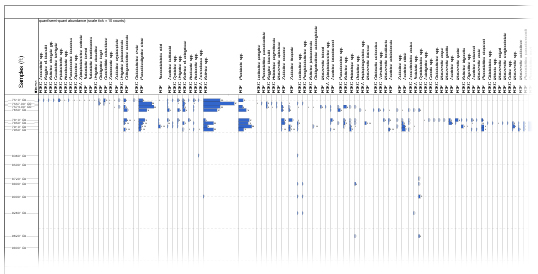
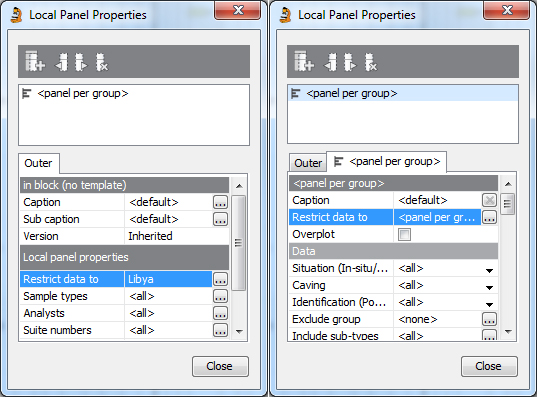
I’m browsing some micro data in the Standard Chart in Samples & Interpretations. I can make quick changes to the panel properties here by right-clicking.
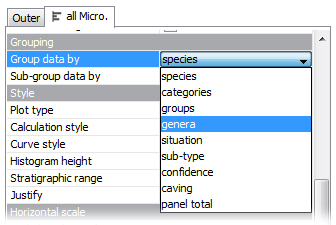
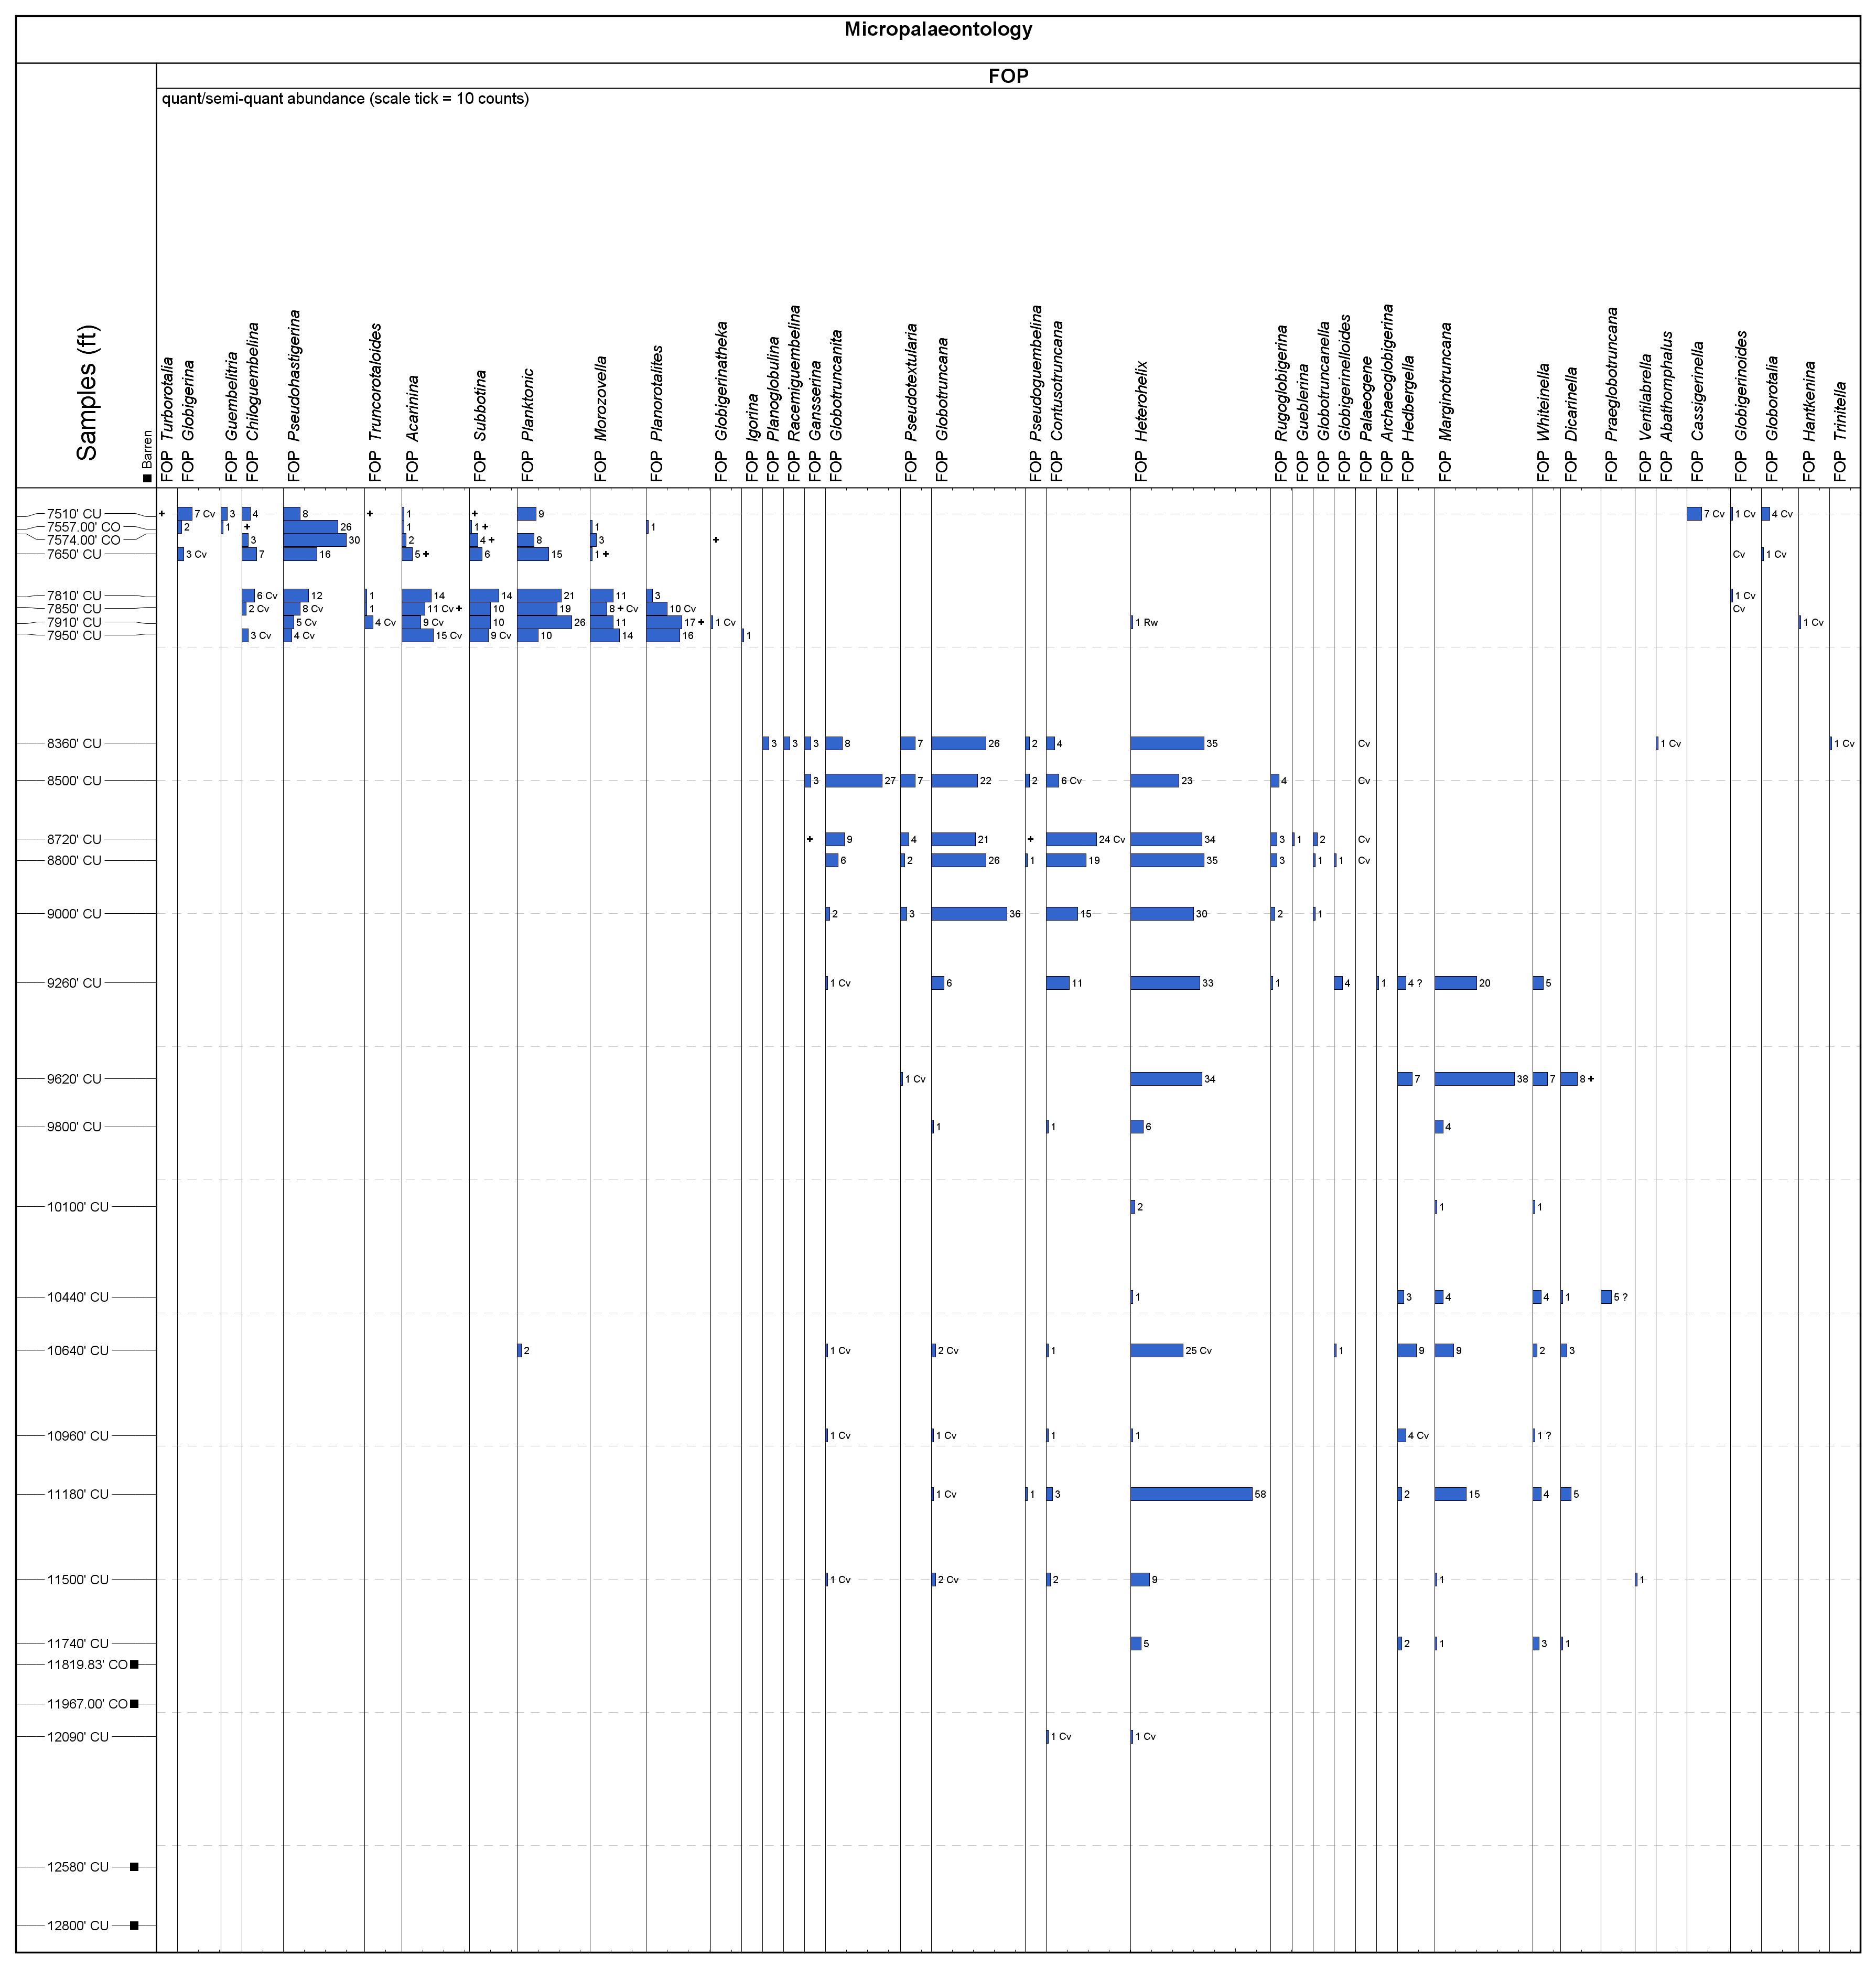
I have quite a lot of different species, so I’ll first try to simplify it a little by changing the panel’s ‘grouping’ property on my chart to “genus”. I now have one column for each genus. I’ll also restrict it to just the planktonic forams.
 Now I can see a little better what I’m dealing with. I’d like to confirm that these species roughly fall into their assumed age zones. It would be nice to home in on the Cretaceous / Tertiary boundary. To do this I will need to put the species into groups.
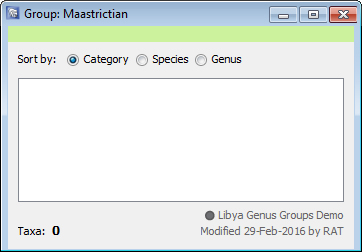
Over in the Taxon Database module, I’ll start by creating a Maastrictian group.
I can drag and drop genera into here from my chart’s header area. Just click on the text and drag across to the group (it helps if you have two screens here). I’ve picked out a few Maastrictian genera which I can see are represented in my data.
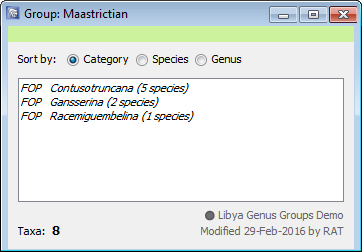
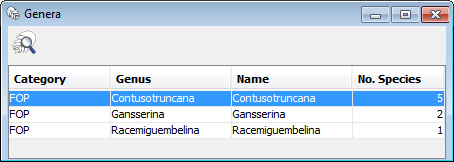
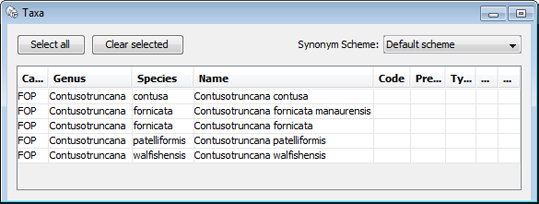
Note how the genera in this group appear in italics, and indicate the number of member species. This is the number of species in the whole database, not just this well. If you want to see what they are, you can drag and drop the genus name onto the taxa window:
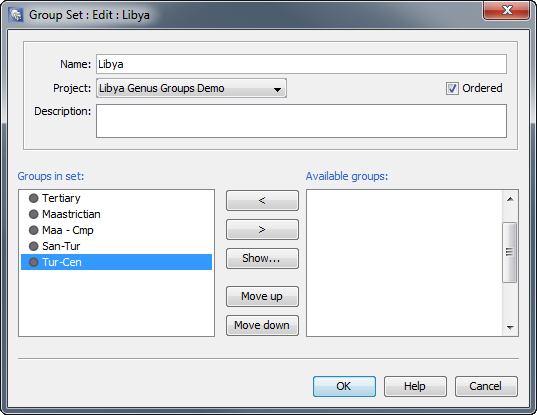
To help with my chart, I’m going to create a group set (group of groups). I’ve added my Maastrictian group to it. While I’m here, I’ve set up some empty groups for other ages, and added them to the set. Notice that I’ve made it an ordered set (this was another new feature for 2.1).
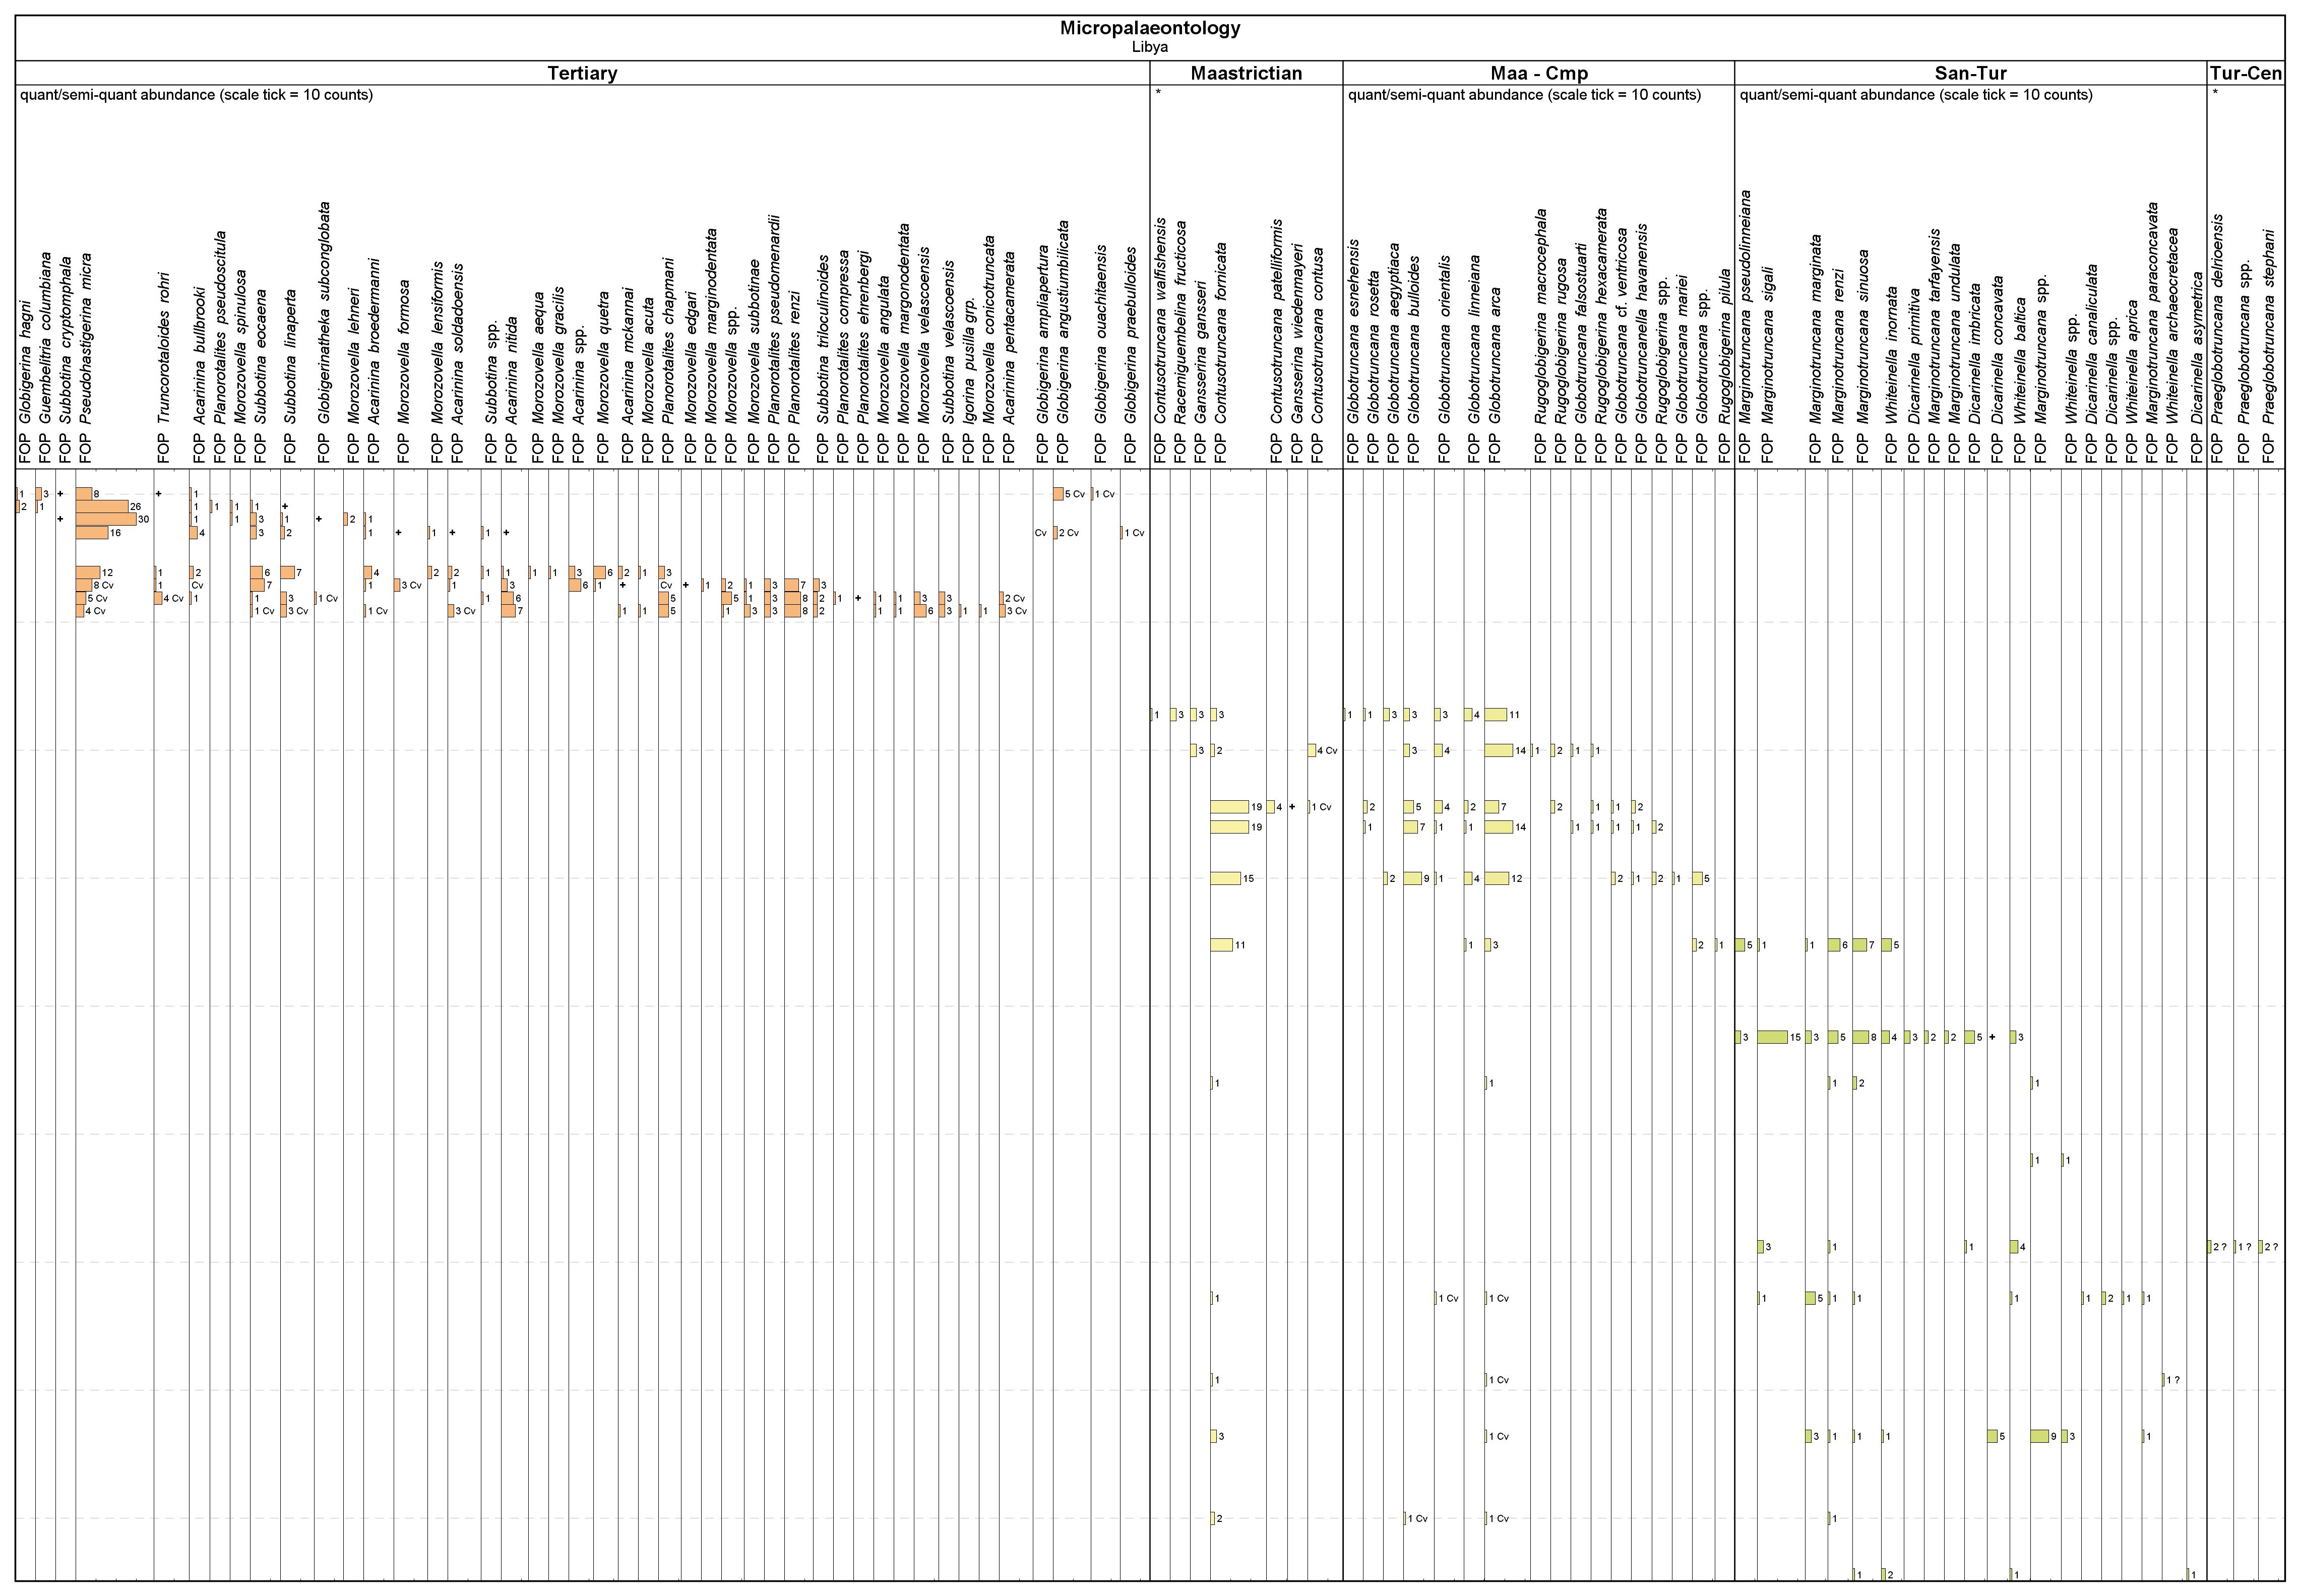
I’ll add another micro panel into my standard chart so that I can see the picture emerging as I build the groups. This time the outer panel is restricted to data from my set, and for the inner panels I have one panel per group in the set (all have the same settings).
Now I can populate the other groups with some genera I expect to find at roughly those ages. I’m still dragging them from the standard chart into the group windows in Taxon Database. As I populate the groups, I gain more inner panels. The picture is starting to emerge.
 I had better save this layout so that I can use it for my next well.
![]()

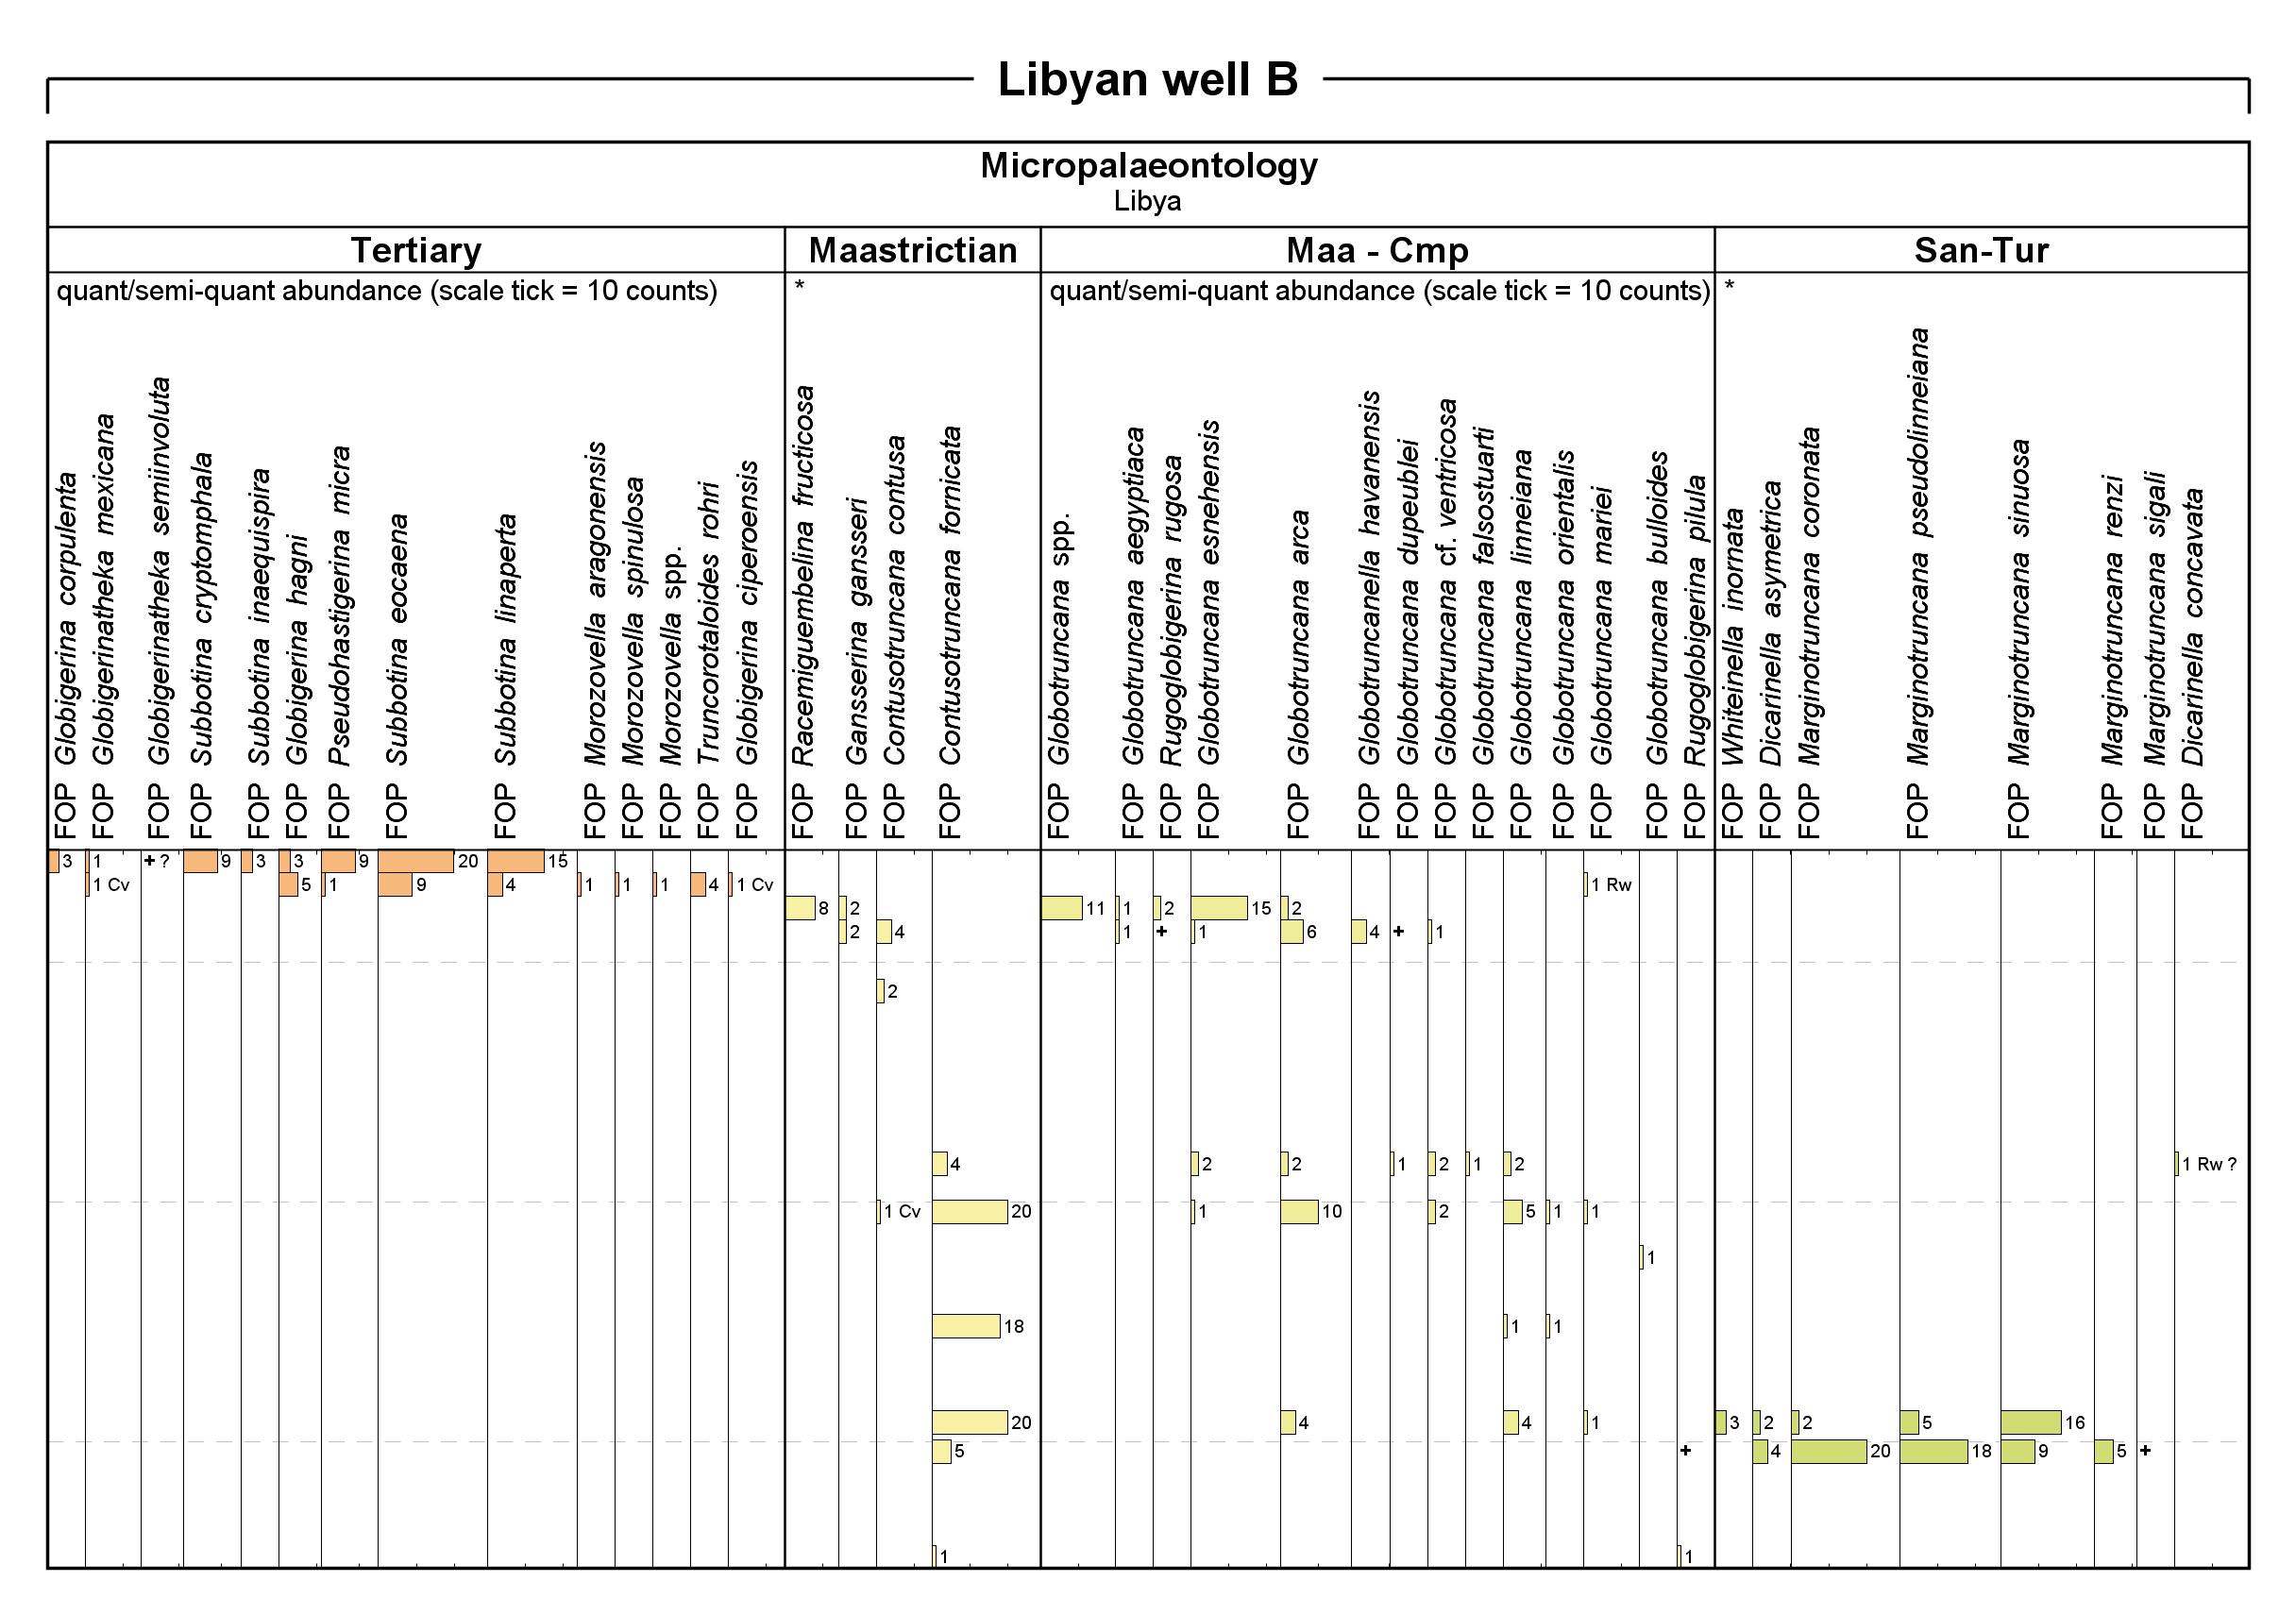
It’s just a few clicks to open my template for the next well, and see the story there too – even if the exact species mix differs slightly.
![]()
OK, so it wasn’t really my data, and I don’t know my Maastrictian species from, well, blobs of sand really – so thanks to John Athersuch for providing the data and groups 🙂
3 comments
Comments are closed.
Hello, is there anyway to arrange the taxa in a systematic order on a chart, in Stratabugs v2.1?
To add a little to this – of course you are not restricted to using groups based on age ranges – in fact you might do this better if you already had a relevant composite standard set up – but that’s another story! Other uses for grouping genera might be for making environmental groups where as much information can be gained by observing distributions at a generic level as at the specific level. For instance I might want to group all species of Limnocythere, Candona and Iliocypris in one group, Cyprideis and Cytherissa in another, Leptocythere, Amnicythere and Callistocythere in a third and Carinocythereis, Aurila and Urocythereis in the fourth to indicate different salinity tolerances. There are many more examples which I am sure you can think of in all disciplines. Of course if you have datasets in which genera are represented by only one species it may be easier to build your groups in the usual way.