Month: April 2021
Should groups contain only unique taxa?
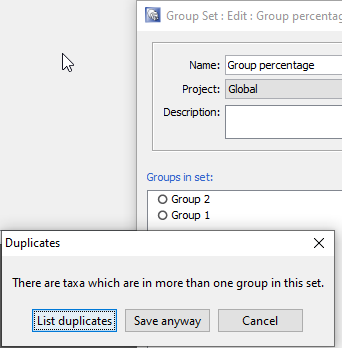
Taxon groups in StrataBugs can contain any number of species (or genera, since v2.1). Groups can be added to a Group Set, which allows the relative proportion of the taxa in each group to be plotted, often in the form of compact “closure” diagrams that show stratigraphic or environmental trends. So far so good. We’ve pretty much assumed that, up until now, a Group Set will contain an exclusive set of taxa; i.e. each taxon will only occur in one group, when that group belongs to a Set. Indeed, when you create or edit a Set in the Taxonomic Database module, it warns you if there is any duplication between the groups, and allows you to see the duplicates:
But what happens when a taxon belongs to more than one group in the Set? What if you have groups that reflect broad environmental conditions, and some taxa are present in a range of environments which spread across more than one group? To display these groups as a relative abundance curve would be to double count the abundance of taxa in each group. But to include them in some groups and exclude them from others seems arbitrary. Up until now, the latter is what has happened in the v2.1 charts, and this has been inconsistent with the previous behaviour in the “legacy” charts. In the “legacy” charts, each taxon was added to the total for each group, so if a Group Set was plotted with relative group abundance, those groups with duplicate taxa would be more heavily weighted compared to the other groups. In the v2.1 charts, the taxon is only counted once – but this has the distorting effect of ignoring the influence of the taxon in any subsequent group it might appear in.
I think a better solution exists than either of these scenarios. If a taxon exists in more than one group, then perhaps the weighting of that taxon’s abundance should reflect the number of groups that it is spread between. So if it occurs in two groups, then 50% of the count gets allocated to each group. We have just updated the v2.1.1 (and v2.1.1-14) release to reflect this new thinking.
Let’s look at a simple example to illustrate the change. Suppose we have two groups; Group 1 and Group 2. Group 1 contains one taxon (Ammonia spp.); Group 2 contains 2 taxa, Ammonia spp. again, and Elphidium spp. Both taxa are recorded in an analysis, each with a count of 10 specimens. The total count is 20 specimens. Let’s start by plotting this in the legacy chart application:
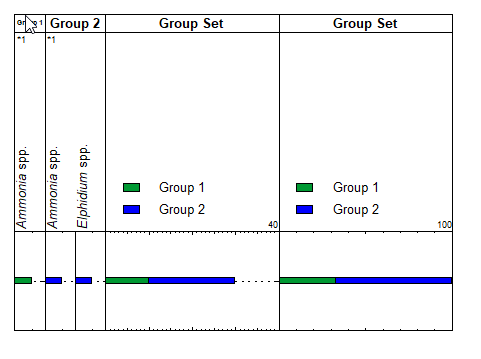
The first panels, Group 1 and Group 2 plot as expected: an abundance of 10 for each specimen. No problem there. In the third panel, showing the Group Set, the duplicate taxon in Group 2 is counted twice, so although the panel looks reasonable, the total count displayed here is 30 – whereas the true total count is only 20. The fourth panel, the relative abundance of the groups within the Set, also looks quite reasonable, but the proportions don’t correctly reflect the proportions of the contents of the groups.
Now we plot the same data in the unmodified v2.1 charts:
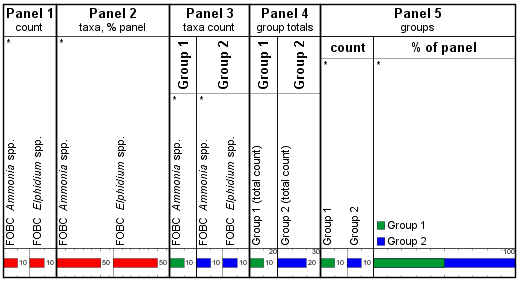
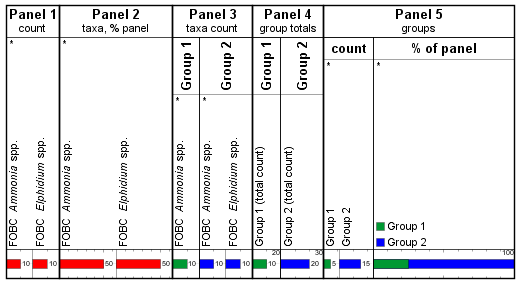
Panel 1 shows the individual taxon abundance; Panel 2 shows the abundance of each taxon as % of the total. Panels 3 and 4 have inner panels for each group, and show the count of individual taxa in the group and the group totals respectively. Ammonia spp. contributes to the count in both groups. The inner panels in Panel 5 each show the Group Set, divided by its constituent groups. Now we see an equal count (and % distribution) of Groups 1 and 2, because Ammonia has been counted in Group 1, and isn’t counted again for Group 2. This is different to the “legacy” chart above, but still does not accurately reflect the group proportions.
Worse, when we rearrange the Set’s group order, so that Group 2 is now plotted first, we see Group 1 disappearing completely in Panel 5:
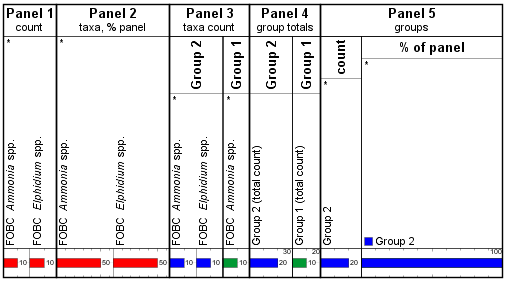
In the modified version which is now released, we divide the abundance between split groups, so we get this:
Panels 1-4 are the identical, but Panel 5, which shows the Group Set as a whole, has the 10 counts of Ammonia split between Groups 1 and 2. This means the total of the absolute abundances is (correctly) 20, and Group 1 only has 25% of the weight (as opposed to 33% in the legacy charts, and 50% – 0% in the previous version). The proportions remain the same when the groups are reordered. This also highlights the subtle but important distinction between plotting separate inner panels for each group (as in 3 and 4) compared to separate tracks for each group (as in each inner panel in Panel 5).
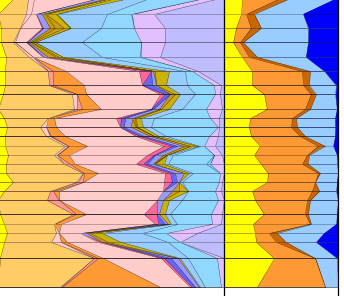
Finally, a real world example. This Group Set contains several hundred species which are ranged across different water depths. The left panel reflects unique group assignments: taxa ranging across environments are assigned to a group which exclusively contains taxa of the same range. It is difficult to get the group ordering right, with overlapping ranges, and the colour assignments can subtly affect the visual result. In the second panel, where there are fewer groups but taxa can occur in multiple groups, the deeper water depths are under represented.
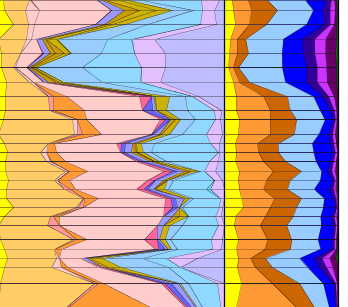
When we display the same panels with the modified version, we see a more even spread across the main groups:
This issue only affects you if you use overlapping groups, so may not be a big deal, but perhaps some explanation of what’s going on here is useful, and it can be an opportunity to more easily group taxa for displays of this kind.
Your head’s probably spinning by now and you probably wish you’d never started reading this, but if you’ve lasted out until the end, and feel the urge to comment, we’d welcome any feedback.
Saving sessions, and clicks
Those of you that typically use the “Restore Session” option when reopening the Samples & Interpretations module will have noticed that although the previous sessions wells/outcrops and tabs are restored, it didn’t reinstate the previous tab selections. This hasn’t seemed to us to be a very big deal, as we assumed that most people, most of the time, tend to work more intensively on fewer wells, so the task of clicking on a few tabs to get back to the block template you were last viewing, seems trivial.
The assumption doesn’t hold true for larger field review studies, or for shallow borehole geotechnical work which typically involves tens of boreholes (the usual scenario for BioChron). In these cases, being able to reopen your session with the same tabs open can save a lot of clicks. If this applies to you, then an update to the latest release of v2.1.1 or v2.1.1-14 is all you need to do.
If you do restore a session but get an error message pop up during the restore, then copy this to us (as always) with a simple screen shot, but don’t worry unduly because an error in this phase is unlikely to need anything other than a few extra clicks to get back to where you were.