Month: July 2016
Event Confidence
Confidence levels for events are a new feature for v2.1. You will be more sure about the position of some events than of others. A strong flood of specimens makes a more definite marker than a single, poorly preserved top. Can you be sure you have located the relevant abundance peak? If you are going to base other interpretations on event picks (especially a depth/age curve), then you will want to give yourself some guidance as to the reliability of those picks. Here I will demonstrate the ways you can apply confidence to events in order to give yourself this support.
Events in wells
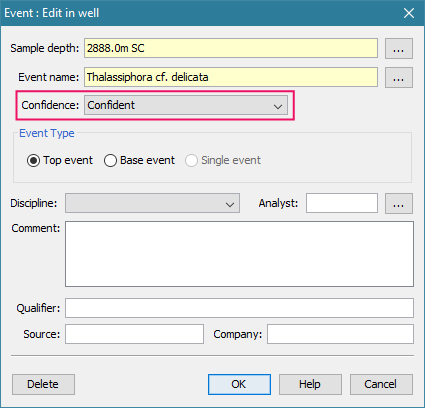
To change the confidence level for a well event, select from the drop-down in the Event dialog:
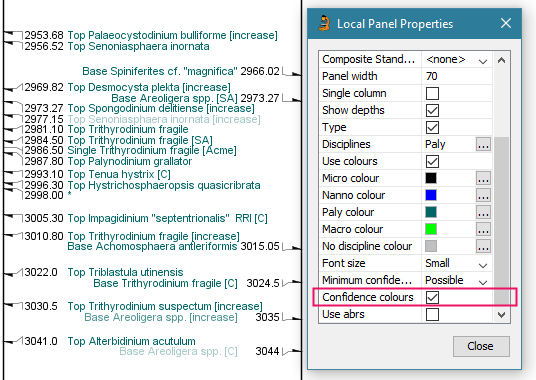
You can set the events panel to display less confident events in a lighter colour.
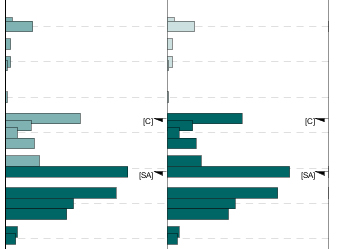
Don’t forget that you can display events on your taxon distribution chart (for example, download the “Event Age” panel template from here). This is handy for deciding on the confidence level – you can easily spot the more dubious events and designate them accordingly. You can double-click on an event to edit it. In this panel, the colour changes where the event is picked. The colour change is more pronounced where the event is more confident.
Events in time (composite standard events)
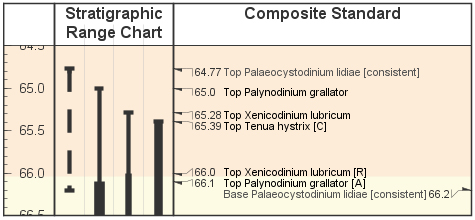
Composite standard events are configured and displayed in much the same way. The stratigraphic range panel shows ‘probable’ events with a dashed line and ‘possible’ events as a dotted line.
Cross-plot of events (depth/age chart)
On a depth/age chart, confidence levels of both types of event help you when placing your curve. Events are shown with a lighter-weight line when their age is less confident, and a lighter colour when their depth is less confident.
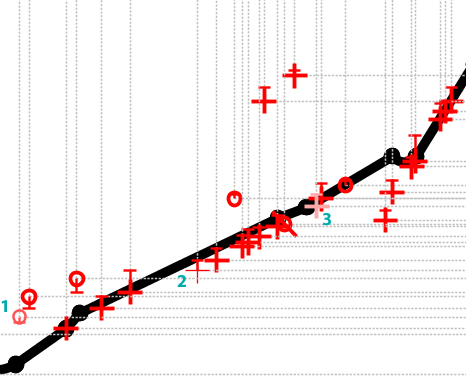
Note that the confidence is subjective: it’s not based on data from adjacent samples. The event depth range “tails” are based on the next analysis within the discipline under the assumption that, for instance, a top event could extend right up until the next sample, and vice versa for a base.
Abundance Events in Stratigraphic Range Charts
In recent weeks we’ve been busy enhancing the stratigraphic range chart plot to display abundance events. Many thanks to Martin Pearce at Evolution Applied for working through this with us.
The stratigraphic range panel is designed as an alternative type of view on a composite standard (event scheme). It shows the ranges of events in time.
A note on terminology: the ‘range chart’ I will be referring to is different from a ‘species distribution chart’ showing abundance variations in a well section – which I do often hear referred to as a ‘range chart’. The range chart in question is concerned with time.
A simple range chart showing a few species might look like this:
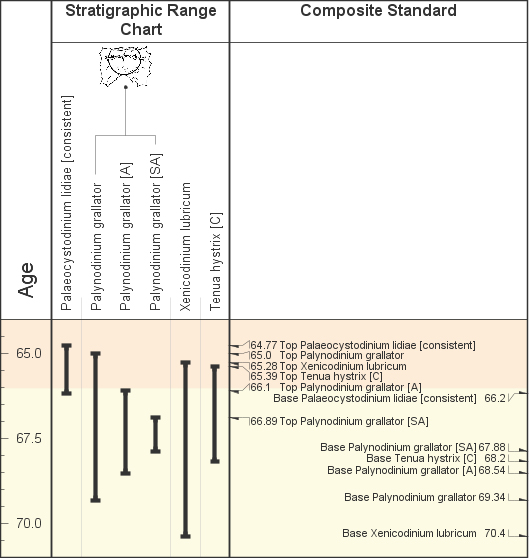
Events relating to the same species are grouped together. In this case there are three events for Palynodinium grallator – a total species range, plus two abundance event ranges.
At the moment there is no formal way to link these abundance events (denoted by the [A] and [SA]) to an abundance scheme which defines them. A simple workaround is to create an abundance scheme with exactly the same name as the composite standard. The stratigraphic range panel will pick this up and use it to identify abundance events. Any term abbreviation from the abundance scheme which appears in the event name surrounded by brackets (you may use parentheses, square or angled brackets) will be interpreted as an abundance event. Go to the full post…