Sidetrack Chart
Note: This feature is deprecated and will be incorporated into map blocks.
The sidetrack chart feature plots a simple plan of well paths as if seen from above, in coordinates relative to the spud location. Only wells which deviate horizontally from the spud point can be plotted; wells must have deviation surveys which include northings and eastings. The project map is intended to complement the TVD / Offset Chart, which does not indicate the horizontal curvature of well paths.
Setting up a sidetrack chart
Before you attempt to plot the chart, ensure that:
-
The wells you wish to plot belong to the well list (do this in the Wells & Outcrops module)
-
The wells have the same geographical coordinates. You can set the coordinates in the Well: Edit dialog, on the location tab. It does not matter whether you use degrees, minutes and seconds or decimal degrees. Note that unset locations will show 0 in all fields, and if all the wells have 0 locations then it will be assumed that their locations are the same.
You do not have to set the same coordinates for every well in the project.
- The wells you wish to plot must have deviation surveys loaded with northings and eastings. You can calculate northings and eastings from the azimuth, if those data are available. Open the Deviation Survey Dialog from the Wells & Outcrops module, and press Read... to read data from a file. Use the Calculate button to ensure that all fields are filled.
You cannot use the Calculate button to insert northings and eastings unless all the previous rows of northings and eastings are filled in. You can however type in individual values, if these are known. The map will then be plotted using only these values.
Opening and viewing the sidetrack chart
From the Wells & Outcrops module, select the well list you wish to plot and choose Project > Sidetrack chart.
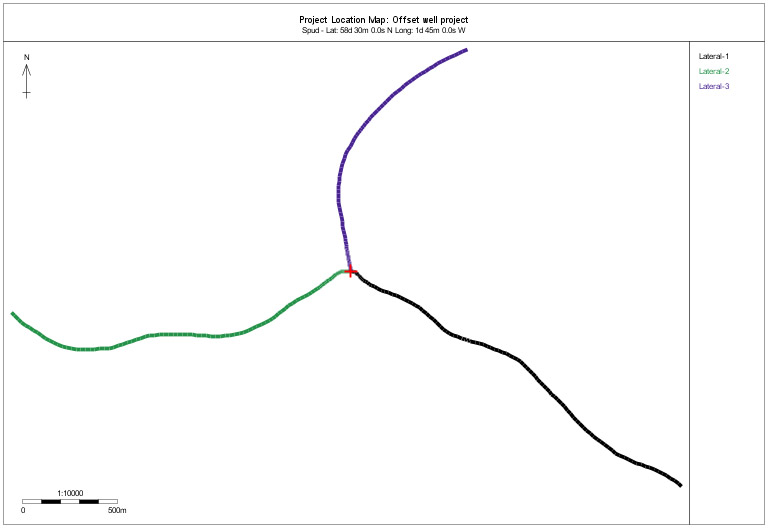
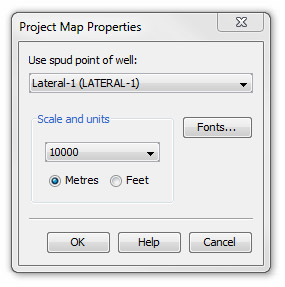
The reference location is marked by a red cross. By default, the location of the first well in the project list is used as the reference location. If this is not the correct well, you can change it by pressing the Properties... button to open the properties dialog and selecting the correct well from the list. You can also use this dialog to adjust the chart's scale, display units and fonts.
Hover the cursor over any point in the map and the north/south and east/west positions relative to the spud point are displayed in the information bar at the bottom-left of the frame. If you hover over a well path, you will also see the name of that well and the approximate drilled depth at the cursor's location.
The chart can be printed from the File menu.
Page last updated: 06-Oct-2022