Printing Sample Logging Sheets
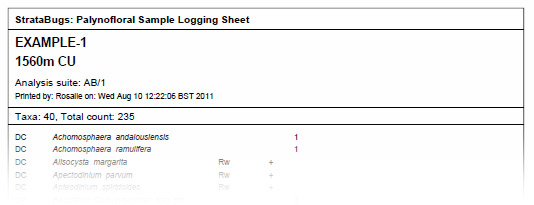
You can print logging sheets or 'tick lists' of analyses from the Samples & Interpretations module. These sheets list the occurrences in the analysis with their attributes and count details. You can also print images.
How to print:
- Open the Analyses tab and select one or more analyses that you wish to print (hint: use the SHIFT or CTRL keys to select multiple rows, or use CTRL + A to select all).
- Select File | Print | Analyses from the menu.
- Select your device from the Print dialog and press OK.
- You will see the Print Preview dialog. You can adjust the Properties of the sheet or the Page setup using the buttons at the top. Scroll through previews of the pages by pressing the spinner. When you are satisfied with the settings, press Print.
Note: although technically you can print on any size page, the logging sheet is designed to be printed at A4 size with reasonable (roughly 25mm) page margins. If you print on a smaller page you may find that the columns are too narrow to display comments or images correctly.
Options
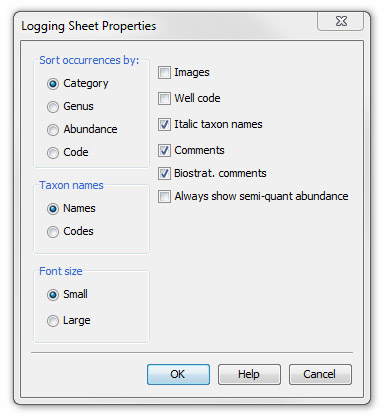
Pressing Properties on the Print Preview dialog shows the Logging Sheet Properties dialog.
Notes:
By default occurrences are sorted by category, then genus, then species.
Comments refers to the occurrence comments, preservation and colour fields amalgamated into one comment (separated by ;). You can edit these comments from the Occurrences tab, by selecting an occurrence and pressing Edit to show the Occurrence: Edit dialog.
Biostrat. comments are the biostratigraphic comments which you see on the Interpretations tab, and also beneath the table on the Occurrences tab. These comments apply for the whole analysis and will be printed in a box under the sheet header. Because biostrat comments are subject to version, you must have a version selected on the Interpretations tab in order to print the comment (which will be taken from that version). The comment will only be printed if its analyst matches sample's analyst.
If you check Always show semi-quant abundance, any quantitative entries will also display a semi-quantitiative field derived from the abundance scheme assigned to the analysis suite. If no scheme is set, no data will appear in this column.
If you choose to sort occurrences by Code (i.e. alphanumeric code of taxon names), you must also display taxon names as Codes. If you select Name and then exit the dialog, the logging sheet will still display codes. In both cases, where there are no alphanumeric codes, names are displayed instead and taxa are sorted in the default way (see above).
Sorting by Abundance: if you are using separate size fractions, occurrences are sorted by the combined total of counts across the fractions. Semi-quantitative data linked to an abundance scheme is sorted by the output value of the recorded scheme class. You can view and edit the values on the Abundance Scheme dialog.
If you set the font size to Large you cannot view comments or images.
Selecting Images will display the first image of the image set associated with this occurrence. Edit images from the Occurrences table. About working with images...
Page last updated: 14-Aug-2014 15:10