Troubleshooting Charts Created in v1.8 (Legacy Charts Module)
Most charts which were designed and saved in v1.8 can be opened the legacy charts module in v2. However, because of the data model changes, you will need to modify the properties of some panels so that they can "see" the data in the new position within the v2 database. In some cases you will not be able to exactly reproduce the v1.8 chart; if you must retain these charts then you will need to keep your v1.8 system installed alongside v2.
See this page for information about concerting legacy charts to the new format.
A brief history of charts: v2.0 retained the Charts module from v1.8. Alongside this, new interactive chart graphics were developed in the Samples & Interpretations module. In v2.1 these new graphics are fully integrated into a replacement Charts module. In some configurations the legacy Charts module can still be run from the StrataBugs Control Panel; the database tables containing the legacy format charts are still in the databsae. Use the information on this page if you have converted from v1.8 or earlier straight to v2.1 or later and wish to open your charts in the Legacy Charts module.
Biozone panels
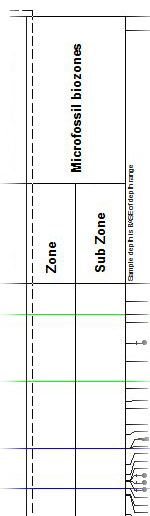
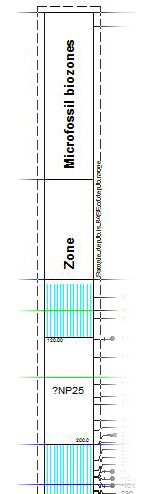
The v1.8 system uses a series of up to four "Panel numbers" to store the biozone data. For v2.0 this system was simplified so that the biozone data are grouped by their scheme. You can plot data for more than one scheme in the same panel, as long as the data do not overlap. When you open a chart, the biozone panels will be blank:
 |
 |
|
Chronostratigraphy, Biozone and Lithostratigraphy panels
If these panels are blank when they should be showing data, you may need to re-select the sub-columns used, because of a change to the column mapping of the scheme hierarchy levels to the panel data. See the column mapping dialog for further information. When you open the panel properties dialog you should only see the columns available in the data column map: if, for instance the well data are all mapped to column 1, and the chart had been saved with only the second column selected, then then panel will appear blank.
Sequence panels
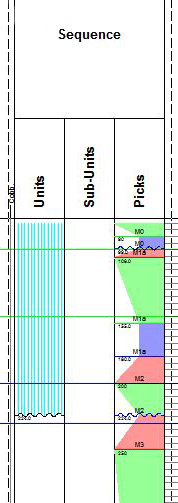
Interval-based sequence data in v1.8 has been converted to pick-based data in v2.0. Set the panel property "Show picks and tracts" to show the converted pick data.
The sequence panels will initially open with a sub-units column selected. Unless you have entered sub-units in your scheme, this column will be blank, and can be de-selected on the panel properties dialog.
The units (and sub-units) are derived from the sequence scheme, along with the sequence tracts. If you do not see any units displayed, then you should modify the sequence scheme in the Schemes & Interpretations module, so that sequence units which join up the sequence surfaces are defined. You must assign numeric ages to the surfaces and the intervals: the ages are used to reconstruct the scheme in the units column. If you do not know the equivalent ages, then use an approximation so that the sequences are ordered correctly and the units can be placed at the correct surface boundaries. In v2 you can place the unit boundaries at the maximum flooding surfaces for a genetic sequence scheme, or at the sequence boundaries/correlative conformities for a depositional scheme.
Note: To obtain the highest sequence interval you may need to pick a top boundary surface at a higher sample where there was no pre-existing pick.
Events panels
Events panels may not be pointing to the correct version; you need to select the correct version on the Panel Properties dialog. You may find that after conversion, a well's events are in a different version to the rest of the interpreted data. This is due to 'event projects' in v1.8 being merged with 'interpretation versions' in v2.0. In these cases it is better to move the event data into the same version as the other interpretations. To do this, open the well in Samples & Interpretations, select the version to which the events belong (on the Interpretations tab), select them all and press Move.
Chart background colours
If the v1.8 chart displayed background colours for Interpretation interval panels, then these may not be displayed in v2. Open the panel properties of one of the blank panels between the well panels. The chart properties may have the chart background level set to a higher level than exists for the well data.
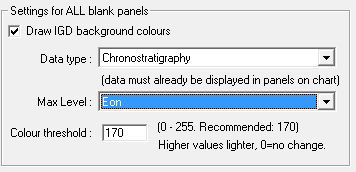
In this example the chronostratigraphy Max Level should be set to a lower level than Eon (the default), since it's likely that the well data will be defined at a lower level. You should set this to a level at which the well data exists, and then you should see the background colours appear. If the data were defined at Period, Epoch and Age levels in the well, and you wish to show background colours at the Epoch level, then you should set this option to Epoch. For those depth intervals where there were no Epoch intervals defined but there were Period intervals defined, then the background colours should plot at the Period level instead.
Page last updated: 05-Dec-2014 12:45