Example Charts
Click tabs to view example stratigraphic charts produced with StrataBugs. Note that these charts are plotted with the legacy v1.8 version. Several improvements have been made to the chart plotter in v2.0/v2.1.
- Example 1
- Example 2
- Example 3
- Example 4
- Example 5
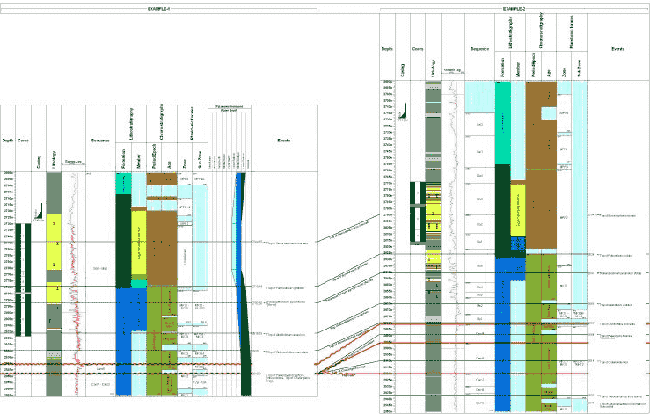
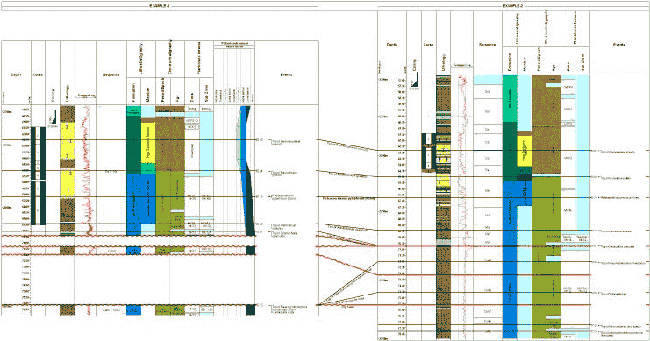
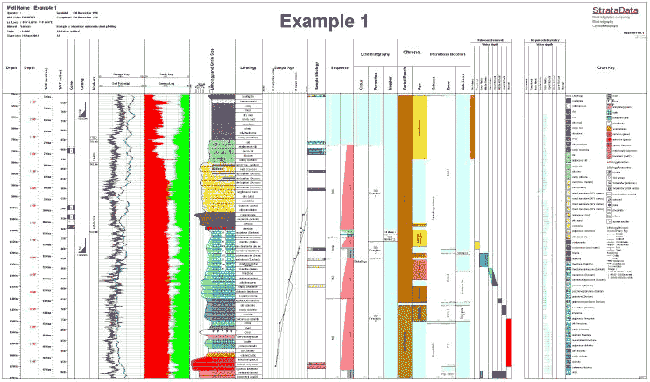
Summary chart with panels displaying various depth scales, cores, casing, markers, wireline logs, graphic lithologies, IGD (interpreted geological data) including sequences, lithostratigraphy, chronostratigraphy, biozones, palaeoenvironments and chart key.
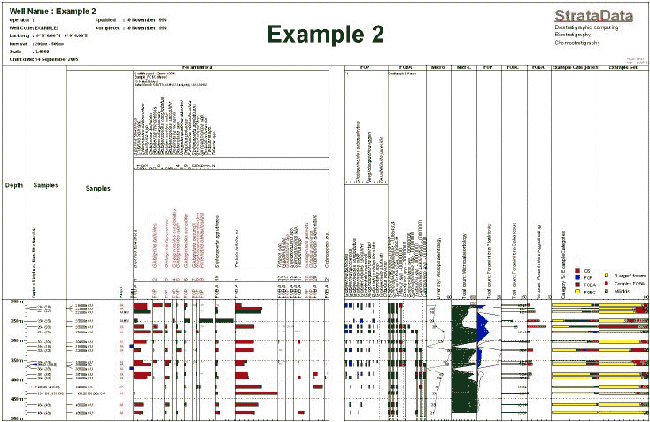
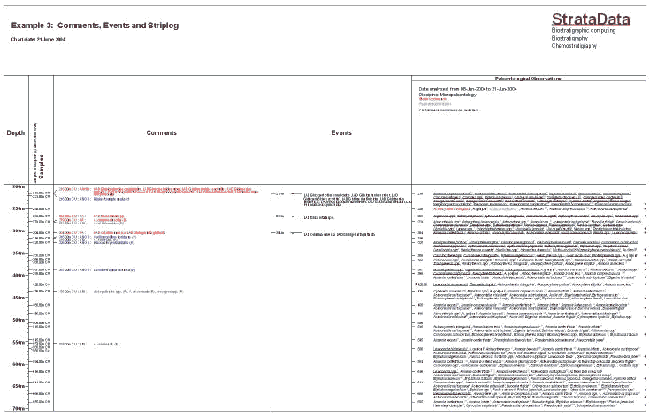
Biostratigraphic distribution chart with panels displaying sample depths and types, analysts, and biostratigraphic occurence data displayed in various styles.
