| << Previous | Learning Trail | Contents | Section 4: Samples | Next >> |
| StrataBugs Learning Trail | Section 4: Samples |
How to record fossil occurrences
Definitions
An analysis is a record of fossil occurrence in a sample. Every analysis belongs to an Analysis Suite, which is a unique combination of the well, discipline, analyst and suite number. The database can store multiple analyses of the same sample if each analysis belongs to a different suite; therefore the same analyst can make multiple analyses of the same samples by recording them in different suites.
For example, if user XXX analyses a set of samples at the well site, his list of analyses might be placed in suite number 1. In the Occurrences tab, the Analysis suite field displays XXX/1. If, when he gets back to his lab, he wants to analyse the same samples again whilst keeping the old data, he can make a new analyst suite with a suite number of 2, and record new analyses there. This is displayed in the analysis suite field as XXX/2.
Recording occurrences
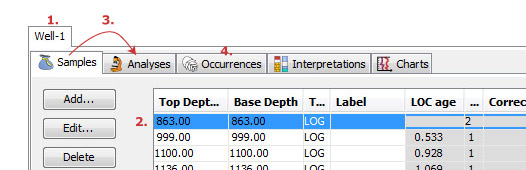
Open the Samples & Interpretations module and select a well.
Select or add a sample from the Samples tab.
- Add an analysis. Do this either in before you leave the Samples tab, by pressing Add Analysis... or in the Analyses tab by pressing Add... In both cases you will use the Analysis: Add/Edit dialog.
Note: adding from the Analyses tab will use the sample selected in the Samples tab ONLY if no row of the Analyses table is selected. If a row of this table is selected, the new analysis relates to the sample in that selection.
If you have already created analyses and want to add to them, you can filter the list by, in the Analyses tab, selecting a Discipline, Analyst and Suite from the drop down lists. This will also pre-populate the Analysis dialog if you choose to add an analysis.
-
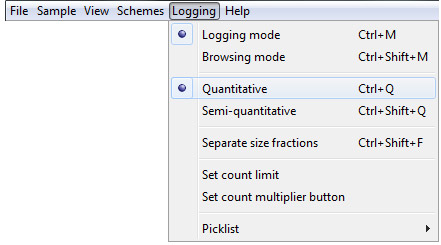
Select your analysis and open the Occurrences tab; the analysis attributes will be displayed correctly at the top. Set the occurrence tab mode to Logging mode (via the Logging menu).
-
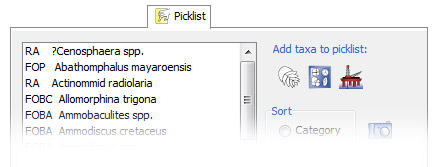
Select the Picklist tab in the right hand pane. Populate the Picklist with taxon names from Groups, Wells or from the database. To do this, select Picklist | Insert from the menu on the Samples & Interpretations main window or use shortcut buttons on the Picklist. If you have previously entered data from a section which yielded fossil assemblages similar to those which you expect to encounter in the current well/outcrop you may find it advantageous to build a picklist based on the taxa from the earlier section.
-
Select Picklist | Abundance options on the main menu bar. You must decide whether to to record quantitatively or semi-quantitatively, and whether to record occurrence independently for different size fractions (most useful in micropalaeontology), and set the count limit. More about working with abundance schemes... You can find more information on using each of these modes on the Picklist tab page.
-
Select a taxon name from the Picklist, and set the picklist controls to an abundance (semi-quantitative) or count (quantitative), and any additional information (such as reworked, caved or questionable)
-
To add the occurrence, either press the
 (add icon) on the picklist pane or double-click the taxon in the picklist.
The name, abundance and qualifiers will appear in the left hand pane. If you want to add a taxon qualified with cf. or aff. or you want to add an unspeciated genus (spp.) and it is not on the Picklist you may do so "on the fly" using the appropriate option buttons.
You can increment the count of an occurrence by double-clicking its row in the Occurrences Table.
Using an overlay
If you prefer not to use a list to enter records you can use an on-screen overlay bearing the names of the taxa you expect to record. To open an overlay, select File | Overlay | Select... from the menu bar. The overlay will appear on top of your existing display but can be resized to suite your requirements. This method is ideal for dual monitor operation. The overlay is similar in layout and function to the overlays used with Concept keyboards in earlier versions of StrataBugs. The overlay can also be used in conjunction with a touch senstive screen, or a tablet device such as an iPad. More about using overlays...
Using a Logging Sheet
You can use a printed logging sheet or tick sheet to record data at the microscope for rapid entry afterwards. More about using logging sheets...
Benefits of numerical counts
Whenever possible, use numerical counts as this gives greatest flexibility when displaying your data. There are a number of calculations which can be made from numerical data when you design your charts. Calculations can be based on the taxa displayed in independent panels on a chart.
You may for instance calculate percentage abundances and explicitly include or exclude individuals or groups of taxa. A special case is "outside the count", a method favoured by many palynologists. This method allows rare taxa to be recorded outside the statistical cut-off for a standard count. Taxa recorded in this way can be displayed on charts but do not feature in any calculations. These taxa are indicated by a '+' symbol.
A variant of this method is to count up to (for example) 200 palynomorphs of all types, and then to count until (for example) 200 dinocysts have been found. In this case the recommended procedure is to record "dinocysts" as a single taxon for the purposes of the initial count. This will enable you to display all palynomorphs in one panel as % based on 200 counts (excluding the dinocysts but including the "dinocyst count 1") and all dinocysts in another panel as % (of the dinocysts only) also based on 200 counts.
Page last updated: 05-Dec-2014 9:14