Charts Glossary
A collection of panels which share a set of properties known as the "block properties". Block properties include a well, scale type, scale min/max values, version and caption. Most blocks are based on a block template: a block is simply a block template which has been given a data context. |
|
A list of panel templates together with their captions and versions. The properties of each panel are not part of the block template (they are the panel template), unless the panels are "decoupled". More on block templates... |
|
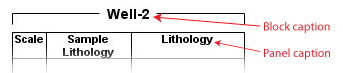
The "title" which is displayed for a block or a panel.
Panel captions (and sub captions) are a property of the block template to which they belong (this means you can reuse the same panel template with a different caption). Set panel captions via the panel properties table in the charts module. Block captions show as a label above the block (in previous versions of StrataBugs this was the "Well Name Panel"). For well blocks, the default caption is the well name. For scheme blocks, the default caption is the template name. Display of block captions in a chart can be toggled on and off via the chart properties dialog (dimensions tab). Block captions can be templated using the caption builder dialog. |
|
A collection of blocks (applied block templates), and correlations (applied correlation templates), along with a set of chart properties. The chart properties include font size, header dimensions, background colour and key. Set the chart properties using the |
|
A line on a chart which connects data points in different blocks which are based on the same dictionary item. Correlatable items in wells are events (well events based on event dictionary), sequence picks (which are based on surfaces from a sequence scheme), and stratigraphic intervals (where they are formally linked to a unit from a stratigraphic scheme). Correlation lines are added to a chart as part of a correlation template. This could be a formal list of correlatable items or a "standard correlation". |
|
A panel design which is "private" to a block template. Use this feature where a panel design is specific to one block only and you don't want to use, see or change it anywhere else. More... |
|
Every panel type has one global panel template which is nominated as the default (this is a database-wide setting and is the same for all users). The default panel template is used for panels added to the Standard Chart (see below). You can change the properties of the default template, or change which panel is the default, in the Charts module. |
|
|
|
A rectangular region of a chart displaying a certain type of StrataBugs data. Panels are always based on a panel template. |
|
The design for a certain type of panel - a set of "panel properties". This might include panel width, colour, option to show depths, etc. Each type of panel has a different set of property options, ranging from a small, simple set (e.g. casing panel type) to a complex and flexible set of options (e.g. biostratigraphy panel types). The panel template does not include any data context (such as well, scale etc). Panel templates are usually created and modified in the Charts & Templates module when creating a block template design. They may also be saved from "local" panel property modifications in the Standard chart tab in Samples & Interpretations. |
|
A single-block chart which is not based on a block template and is not saved. The Standard Chart in Samples & Interpretations is automatically generated based on a current data available. Panels in this chart are based on the default panel template for their type (see above). You can set temporary properties on the panel; add, remove and re-order the panels; and save the whole chart as a well block template. The Schemes & Interpretations module also has a Standard Chart which is created when you press Plot in the Stratigraphic Schemes window. | |
The design for part of a chart. Panels, blocks and correlations are all based on templates. The link to the template is permanent. Any change to the template will be reflected in any chart referencing the template. All templates have a name, description and project. They can be set to "read only". |
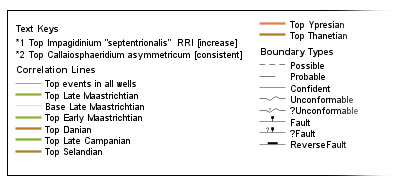 The chart key or legend gives further information about the chart display. It may include overflowed text and explanations of semi-quant abundance. Switch on the chart key and change its properties via the
 Page last updated: 18-May-2015 10:19