Tag: workflow
Contaminated data?
It’s been a while since the last blog post. We’ve been busy getting v3.0 out there and fixing anything that’s been cropping up, and many have now upgraded, or plan to upgrade in the near future.
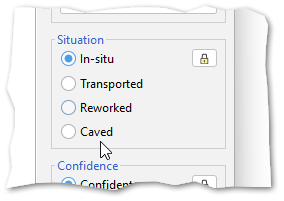
One of the small but important changes in v3.0 was the addition of an occurrence type for “Transported” specimens, being those that are reworked environmentally but not stratigraphically. As well as this, we combined the “Caved” attribute into the same occurrence type, making them mutually exclusive, and thereby forming a hierarchy of “levels of displacement”, which begins with “In-situ” and ends with “Caved”, as illustrated on the new Picklist:
Since this introduction, we’ve had some feedback on whether we should also add a further level, of “Contaminated” occurrences. This would sit below Caved in the hierarchy. These can be specimens from modern contaminants, the lab, or drilling mud itself, none of which implicate caving of the borehole, but would be useful to be able to exclude from certain displays and operations.
We could add this new type as a further option in the v3.0 list. It would not require any changes to existing v3.0 databases, but an application update would be required for v3.0 (and v2.1) to be able to handle any data set which uses the new attribute.
Any comments on this proposal, positive or negative, would be welcome.
Select this view for all open wells
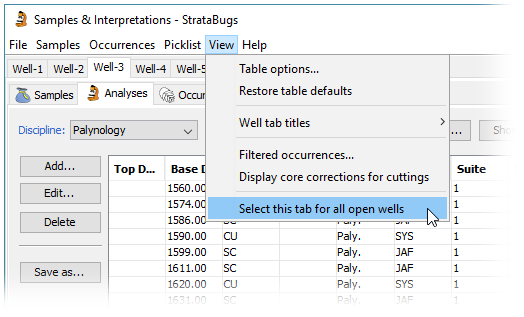
It is a common scenario to open up a project (containing many wells) in Samples & Interpretations, and want to look at the same thing in all of them. Perhaps it’s the micro analyses, the list of sequence picks in a particular version, or a particular templated chart. To save some tedious clicking we’ve added a menu option to replicate the currently selected view, as closely as possible, in all open well tabs.
Open up your project and navigate to the view you want to see in one well. Go to View > Select this tab for all open wells.
- The analysis suite filter (discipline, analyst, suite number) will be replicated for the Analyses tab.
- The version and interpreted data type tab selection will be replicated for the Interpretations tab.
- The selected chart tab will be replicated for the Charts tab, for wells which already have a tab for the same template (hint: you can use the menu option File > Open chart template tab for all wells… to initialise a chart template tab for every well in the project). The selected version is also replicated for the Charts tab.
Genera in Groups
A useful addition to StrataBugs 2.1 is the ability to include entire genera in groups. Previously if you wanted to do this, you would have had to find all the taxa from the genus (probably via a taxon search) and add them to the group. If you or a colleague added another species to the genus, you’d have to remember to add it to the group. The new system saves you this hassle and guarantees that the group stays up-to-date.
You should be familiar with the Taxon Database’s ‘Taxa’ window – this is your working list of taxa. Let me introduce you to its sister, the ‘Genus’ window. Open by choosing from the menu Taxa > Genera.
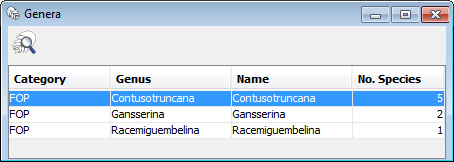
You can populate it with genera by hitting the search icon, or by dragging onto it species from any tables or lists in StrataBugs. Drag a genus from here onto the Taxa window to populate it with the member species. You can also drag the genera directly into your taxon groups. Go to the full post…