Why are my analyses plotting at the wrong depth?
A couple of people have stumbled over this one in recent weeks. No “bug bounties” I’m afraid folks – this behaviour is intentional. Honestly, it’s not a bug, it’s a feature!
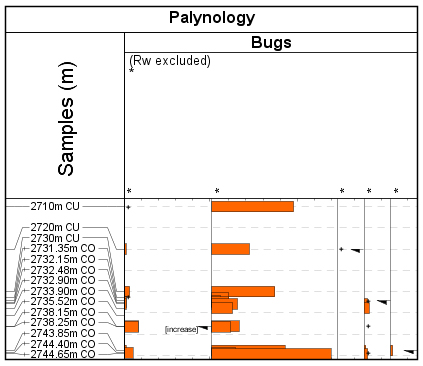
In a high precision study, you may have analysed many samples within a small depth range. If the occurrence data were plotted at the exact analysis depth, then all the histograms and labels would plot on top of each other.
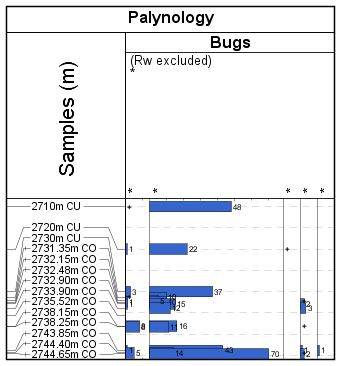
This can make it difficult to see the finer detail. In order to get around this problem, we ‘distribute’ the analyses into the surrounding empty space, such that each data point is readable.
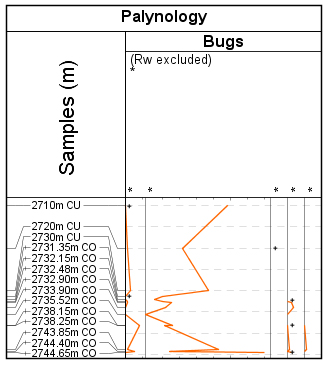
We always do this for the labels in the analyses column (see first image), with each label being plotted next to a line which points to the sample’s true position. When the analyses are distributed, the occurrence data are aligned with the analysis label.
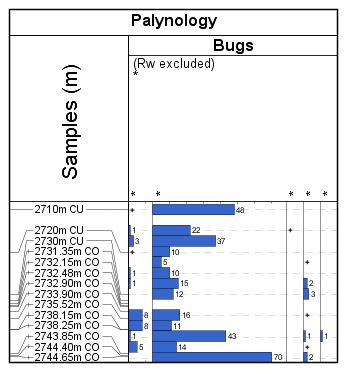
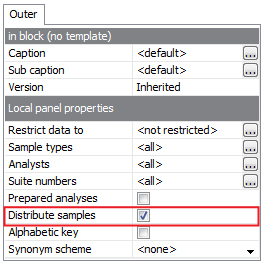
You can switch this option off on the outer panel properties.
Clearly some display styles are more suited to one setting or the other. For example, if you are plotting the ‘curve’ style rather than histograms, it might be more approprite not to distribute the samples.
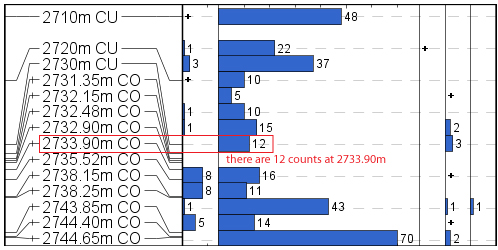
You should be very careful if you are displaying events with your occurrence data (especially if you are doing this in order to pick events directly from the chart). The event ticks are always plotted at their true depth, not the distributed depth. If the occurrence data are distributed, the events may appear to be picked at the wrong samples.
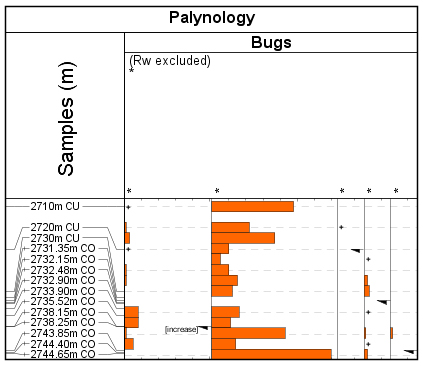
With distribution switched off, it is possible to critically inspect the event picking.