Variable Scale Sections
This is an old chestnut: you want to show different sections of your chart at different scales. The big picture is important, but most of the detail is in one small part. Thankfully you can now have your cake and eat it, by setting up scale sections.
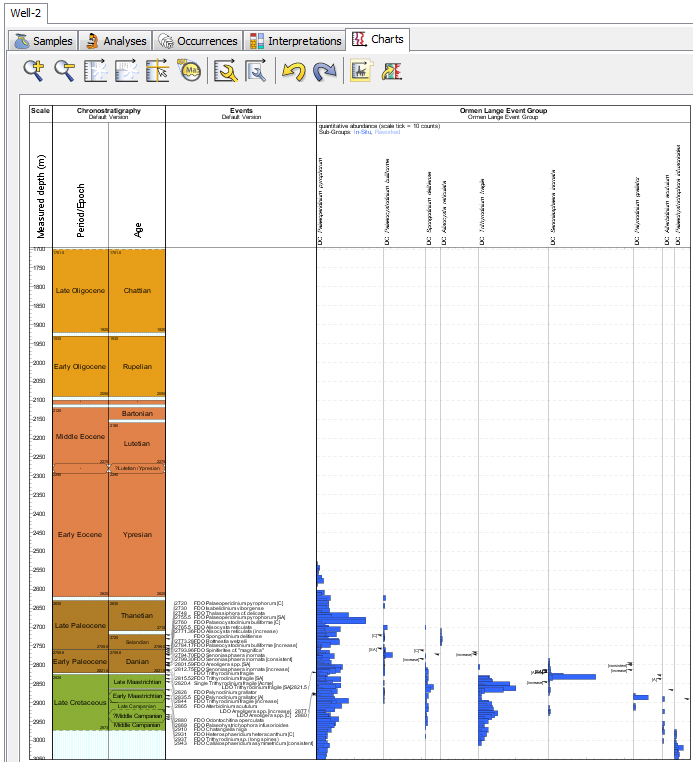
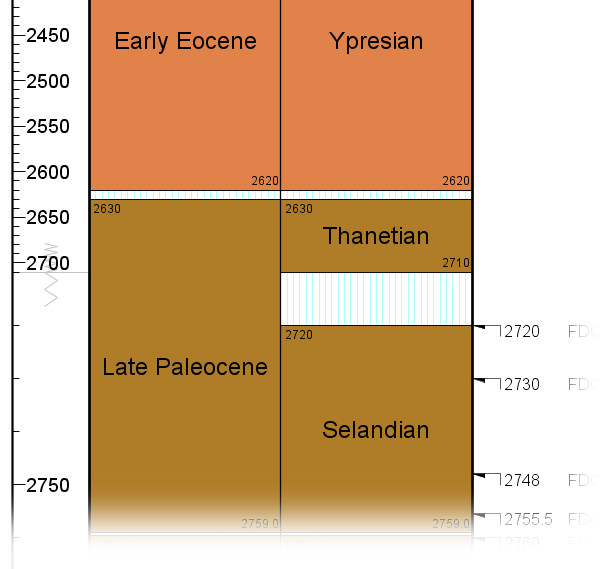
Here’s one such example, where it would be nice to see the detail around the section of event picking without losing the overall chronostratigraphic picture.
To do this, we need to bring up the block properties.
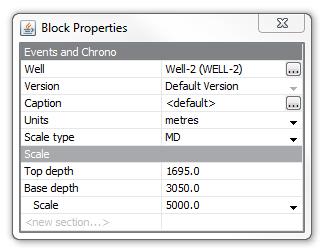
Now we can type a value into the last row on the table (“<new section…>”). The first event is at 2720m, so we’ll start the new section just above, at 2710m.
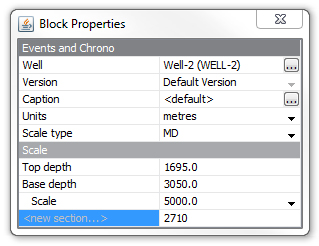
Now press enter, and we have a new scale section for the lower area of the chart, which has its own scale value. With a few tweaks, we can get a lot more data into the same size chart:
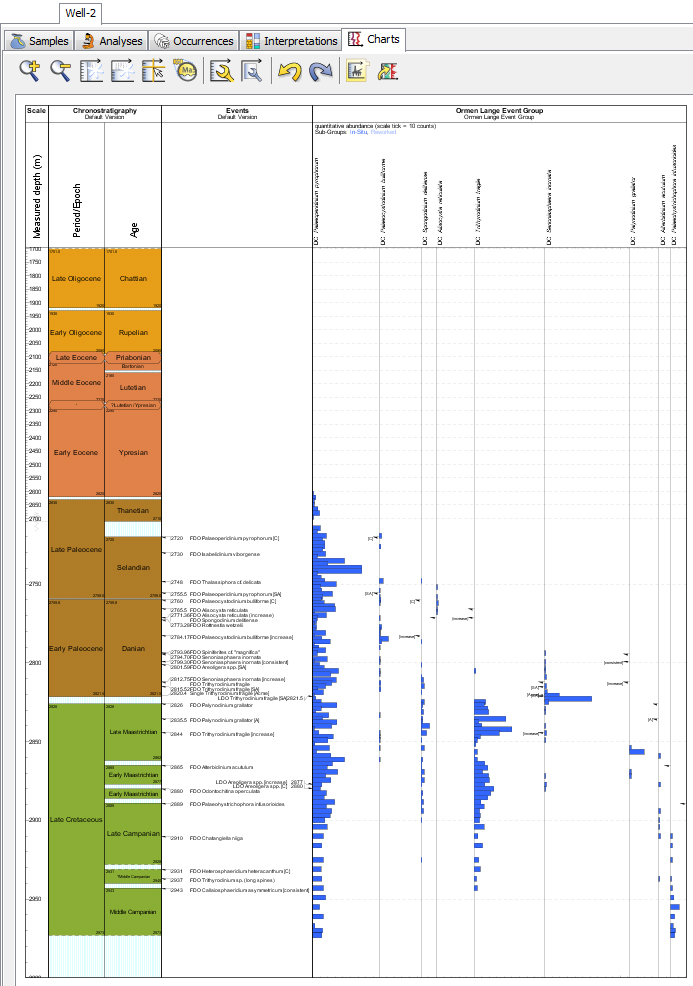
A symbol in the depth scale panel indicates that there is a change in scale:
You make as many scale sections as you like – just keep adding them in the same way. To remove a section, increase the range of the section before or after it such that it completely covers the unwanted section.