Tag: taxon database
Filter by multiple categories
It has long been possible to use StrataBugs to create ‘closure’ diagrams, showing the relative abundance of different groups of species. I use the term ‘groups’ rather than ‘Groups’ intentionally, since the ‘groups’ may also be ‘categories’. A recent change has made this feature a little more flexible.
The new feature in brief
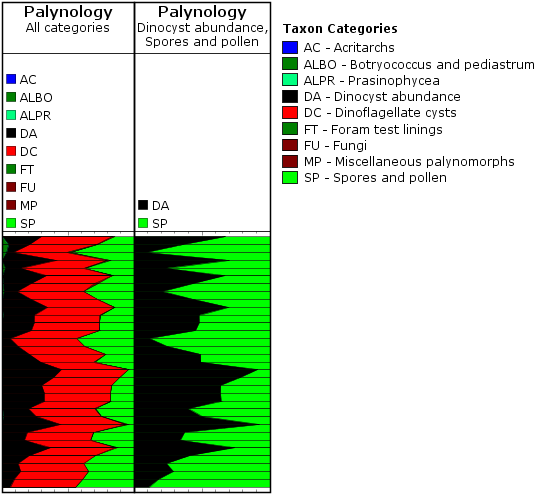
Let’s say a palynologist wants a quick overview of the relative abundance of marine vs terrestrial species. In practice this is achieved by comparing the abundance of dinocysts (category DC) with the abundance of pollen and spores (cateogry SP). Since all species belong to a category already, it’s simply a case of creating a panel which is grouped by category, and displayed as a relative stacked sawtooth plot. The only problem was that all the other palynology categories which happened to show up in the data would also be included in the plot (the left-hand panel in the image below). In the data below, the DA category represents the number of dinocysts in the first 100 specimens, so that’s what I want to compare to the SP count (N.B. your counting method might be different!).
We have now made it possible to ‘filter’ the panel by more than one category, which allows you to create the right-hand panel below comparing just DC and SP. Species not belonging to the filter categories are excluded from the data.
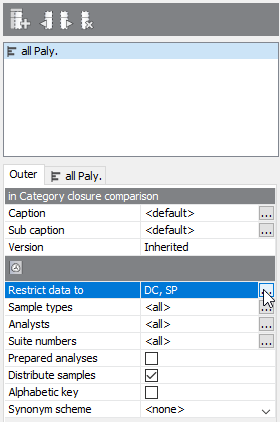
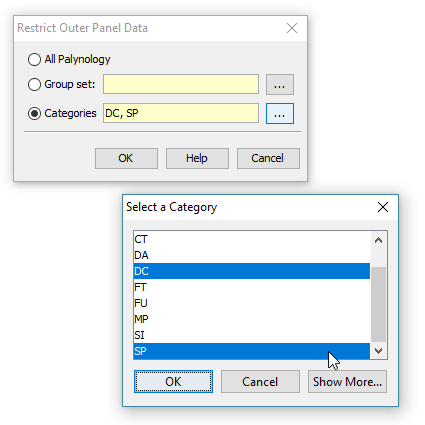
To make use of this setting, you need to select the ‘Outer’ panel properties tab, and choose ‘Restrict data to’. Here you can choose from a list of categories. To select more than one category, hold down CTRL while you select from the list.
A recap on groups and categories
All genera (and therefore species) must belong to one (and only one) category. This is a convenient way of, well, categorising taxa. Most StrataBugs users will not need to modify the standard list of categories – it would make exchanging data between databases more difficult.
Groups, on the other hand, are entirely under your control, and one species can belong to any number of groups. Groups can be attached to projects.
Both are useful for creating charts. You can find our more in the help.
More about closure diagrams
The inner panels above are created with the following options:
- ‘Group data by’ is set to ‘categories’ – this means that counts of species from the same category will be aggregated. You could also use groups here, in which case either the outer or inner panel must be filtered to a group set (which defines the selection of groups).
- ‘Plot type’ is set to ‘stacked curves’ – rather than showing the different categories in individual columns.
- ‘Calculation style’ is set to ‘relative (inner)’ which means that instead of showing the absolute count for each category, we’re showing the count as a percentage of the total for the inner panel. In this case you could also select ‘relative (outer)’ (i.e. the count is relative to the outer panel), because the inner and outer panels are showing the same data (more in this previous post).
You can find out more about the biostratigraphy panel options here.
Time for a spring clean? Episode 1: Taxa and Groups
Spring is in the air here in the UK and I for one have forgotten my new year’s resolutions. Blow away the cobwebs and embrace the new season feeling virtuous by spending a little time spring-cleaning your StrataBugs database. All databases need ongoing tidying up, organising and pruning. It need not be a huge job – a little dusting here and there to keep things in shape will go a long way if performed frequently. Perhaps get into the habit of performing these tasks at the end of each project.
Go to the full post…